OPEN-SOURCE SCRIPT
מעודכן High/Low last 1-3 candles

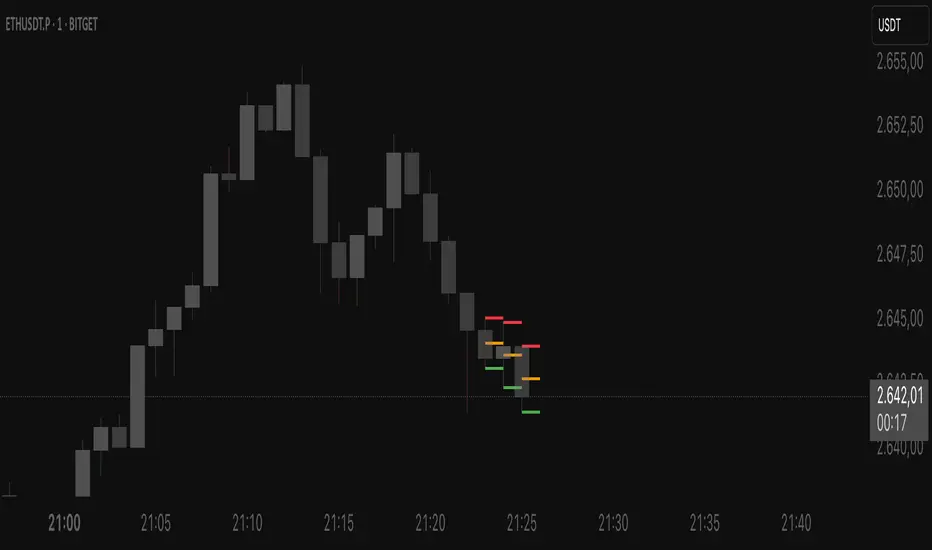
Here you can display the high and low of the last 1, 2 or 3 candles. The whole thing is updated with every new candle. you can also switch the lines on or off as you wish and adjust the colour of the lines. have fun with it
הערות שחרור
Dynamic Candle Levels — High/Low & 50% Lines LiveThis indicator dynamically visualizes the key price levels of the current and recent candles in real-time.
Automatically draws lines at the highs and lows of the last X candles
Marks the 50% level of each candle with horizontal lines
Updates the lines of the currently forming candle live as high, low, and midpoint change
Fully customizable colors, line widths, and number of displayed candles
Perfect for quickly identifying support and resistance zones or intermediate levels at a glance to make faster trading decisions.
Settings:
Number of candles for high/low and 50% lines
Colors and widths of the lines
Option to show live lines for the current candle
סקריפט קוד פתוח
ברוח האמיתית של TradingView, יוצר הסקריפט הזה הפך אותו לקוד פתוח, כך שסוחרים יוכלו לעיין בו ולאמת את פעולתו. כל הכבוד למחבר! אמנם ניתן להשתמש בו בחינם, אך זכור כי פרסום חוזר של הקוד כפוף ל־כללי הבית שלנו.
כתב ויתור
המידע והפרסומים אינם מיועדים להיות, ואינם מהווים, ייעוץ או המלצה פיננסית, השקעתית, מסחרית או מכל סוג אחר המסופקת או מאושרת על ידי TradingView. קרא עוד ב־תנאי השימוש.