OPEN-SOURCE SCRIPT
RSI v4 with Bands
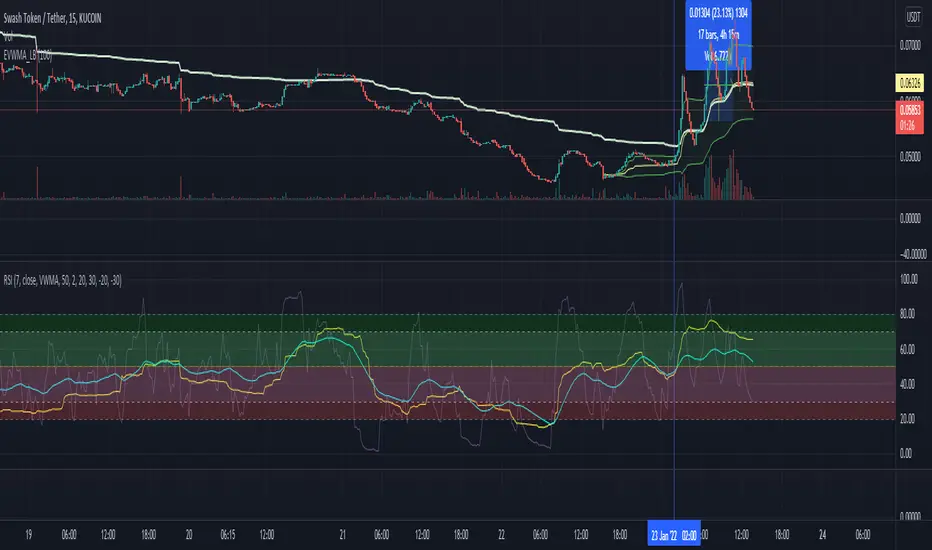
- Script is extended version of usual RSI script
This script plots VWMA(RSI7) [default colored orange] vs EMA(RSI7) [default colored blue] under pre-set time frame.
Strategy is to make sure both points remain in the Green zone while entering into BUY position
Use it as indicator not as financial advice.
~ imbharat
סקריפט קוד פתוח
ברוח האמיתית של TradingView, יוצר הסקריפט הזה הפך אותו לקוד פתוח, כך שסוחרים יוכלו לעיין בו ולאמת את פעולתו. כל הכבוד למחבר! אמנם ניתן להשתמש בו בחינם, אך זכור כי פרסום חוזר של הקוד כפוף ל־כללי הבית שלנו.
כתב ויתור
המידע והפרסומים אינם מיועדים להיות, ואינם מהווים, ייעוץ או המלצה פיננסית, השקעתית, מסחרית או מכל סוג אחר המסופקת או מאושרת על ידי TradingView. קרא עוד ב־תנאי השימוש.