OPEN-SOURCE SCRIPT
NASDAQ Advance/Decline Line 1.0
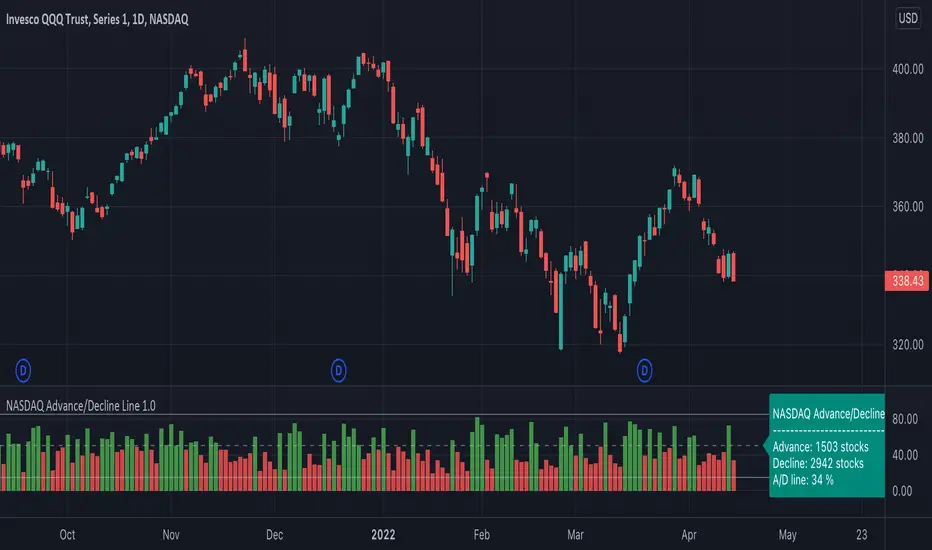
NASDAQ Advance/Decline Line is a Market Breath indicator.
Brought to you by IQ-trading (Andrei Bogdan) via Trading View Pine script. If you find this helpful in anyway, please leave a like!
A/D line calculates a ratio between total number of NASDAQ stocks advancing and total number of NASDAQ stocks in one day, providing another way to grasp the market breath at any moment.A
Green columns mean more than 50% of NASDAQ stocks are advancing, red columns mean more than 50% of NASDAQ stocks are declining.
Green values above the top band mean correlation to the upside, red values bellow the low band mean correlation to the downside.
Correlation means rising probability of capitulation (to the upside or to the downside).
For a better interpretation, NASDAQ Advance/Decline Line should be used in conjunction with other indicators (volatility, volume, etc.).
--------------------
NASDAQ here refers to the totality of assets listed on the NASDAQ exchange, not to the Nasdaq Composite index or the Nasdaq100 index.
NASDAQ is the second-largest stock exchange on earth, and operates the two major stock indexes based on companies that trade on its exchange: the Nasdaq Composite and the Nasdaq 100.
The Nasdaq Composite tracks the performance of more than 3,000 stocks listed on the Nasdaq while the Nasdaq 100 captures the performance of the exchange’s largest non-financial companies.
סקריפט קוד פתוח
ברוח האמיתית של TradingView, יוצר הסקריפט הזה הפך אותו לקוד פתוח, כך שסוחרים יוכלו לעיין בו ולאמת את פעולתו. כל הכבוד למחבר! אמנם ניתן להשתמש בו בחינם, אך זכור כי פרסום חוזר של הקוד כפוף ל־כללי הבית שלנו.
כתב ויתור
המידע והפרסומים אינם מיועדים להיות, ואינם מהווים, ייעוץ או המלצה פיננסית, השקעתית, מסחרית או מכל סוג אחר המסופקת או מאושרת על ידי TradingView. קרא עוד ב־תנאי השימוש.