OPEN-SOURCE SCRIPT
[PX] RSI Barcolor

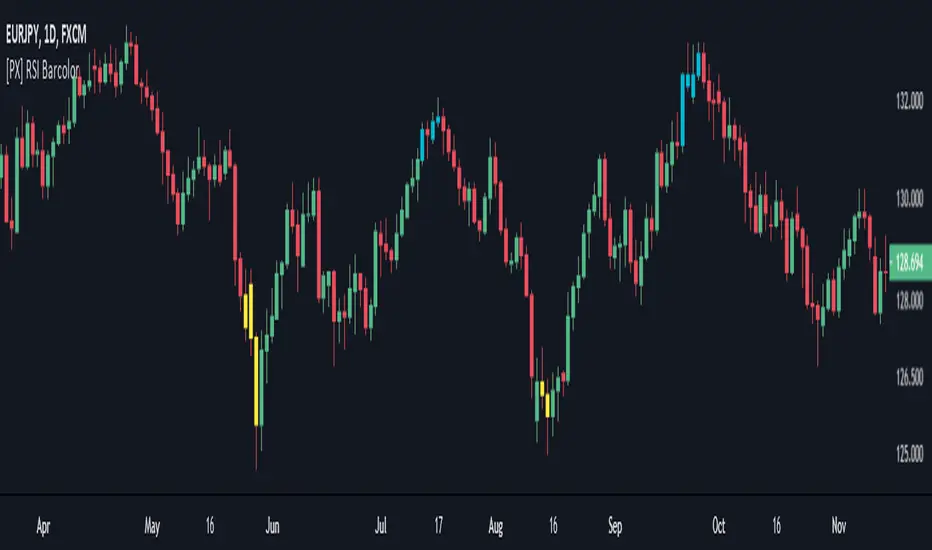
This script simply colors the candles based on the defined "overbought" and "oversold" RSI-levels set in the input section of the indicator.
If the price is below the oversold level, the candle is colored in yellow.
If the price is above the overbought level, the candle is colored in aqua.
If the price moves back between both levels, no color will be applied.
Might be useful for some of you ;)
If the price is below the oversold level, the candle is colored in yellow.
If the price is above the overbought level, the candle is colored in aqua.
If the price moves back between both levels, no color will be applied.
Might be useful for some of you ;)
סקריפט קוד פתוח
ברוח האמיתית של TradingView, יוצר הסקריפט הזה הפך אותו לקוד פתוח, כך שסוחרים יוכלו לעיין בו ולאמת את פעולתו. כל הכבוד למחבר! אמנם ניתן להשתמש בו בחינם, אך זכור כי פרסום חוזר של הקוד כפוף ל־כללי הבית שלנו.
🙋♂️Listed as "Trusted Pine Programmer for Hire"
💰Save $30 on your Tradingview subscription: bit.ly/3OtLyNz
🔓Indicator access: dize-trading.de/
🔒Trial access: discord.gg/DqwKjBZ8Qe
💰Save $30 on your Tradingview subscription: bit.ly/3OtLyNz
🔓Indicator access: dize-trading.de/
🔒Trial access: discord.gg/DqwKjBZ8Qe
כתב ויתור
המידע והפרסומים אינם מיועדים להיות, ואינם מהווים, ייעוץ או המלצה פיננסית, השקעתית, מסחרית או מכל סוג אחר המסופקת או מאושרת על ידי TradingView. קרא עוד ב־תנאי השימוש.