MAPS - HiLo Divergence
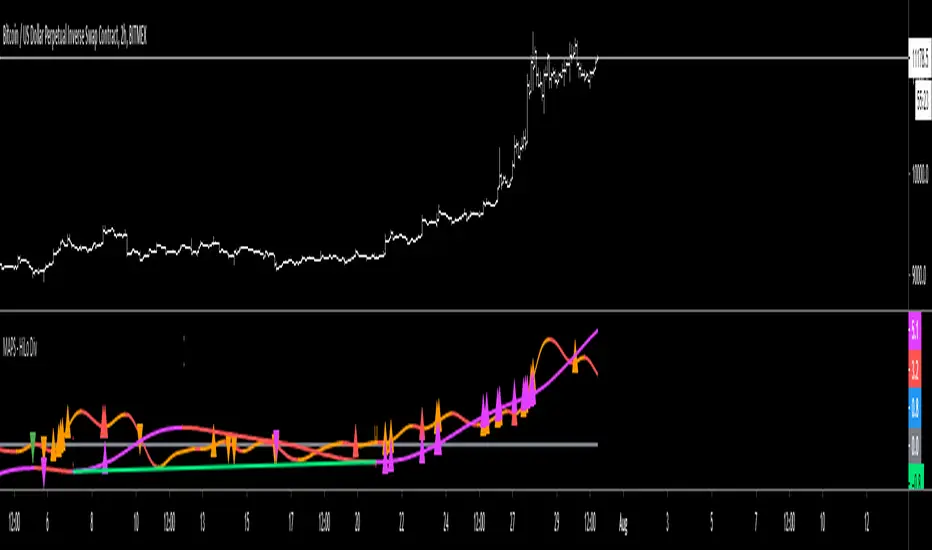
Purple oscillator = Higher Timeframe's price measurement
Purple high triangle = A local high on the higher timeframe has been made
Purple low triangle = A local low on the higher timeframe has been made
Red high triangle on the purple oscillator = A local high on the higher timeframe has been made and is deemed a bearish divergent high
Green low triangle on the purple oscillator = A local low on the higher timeframe has been made and is deemed a bullish divergent low
Orange oscillator = Current Timeframe's price measurement
Orange high triangle = A local high on the current timeframe has been made
Orange low triangle = A local low on the current timeframe has been made
Red high triangle on the orange oscillator = A local high on the current timeframe has been made and is deemed a bearish divergent high
Green low triangle on the orange oscillator = A local low on the current timeframe has been made and is deemed a bullish divergent low
סקריפט להזמנה בלבד
רק משתמשים שאושרו על ידי המחבר יכולים לגשת לסקריפט הזה. תצטרך לבקש ולקבל אישור להשתמש בו. אישור זה ניתן בדרך כלל לאחר תשלום. לפרטים נוספים, בצע את ההוראות של המחבר למטה או צור קשר ישירות עם TheTimeCount.
TradingView לא ממליצה לשלם עבור סקריפט או להשתמש בו, אלא אם כן אתה סומך לחלוטין על המחבר שלו ומבין איך הוא עובד. ייתכן שתמצא גם אלטרנטיבות חינמיות בקוד פתוח בסקריפטים של הקהילה שלנו.
הוראות המחבר
כתב ויתור
סקריפט להזמנה בלבד
רק משתמשים שאושרו על ידי המחבר יכולים לגשת לסקריפט הזה. תצטרך לבקש ולקבל אישור להשתמש בו. אישור זה ניתן בדרך כלל לאחר תשלום. לפרטים נוספים, בצע את ההוראות של המחבר למטה או צור קשר ישירות עם TheTimeCount.
TradingView לא ממליצה לשלם עבור סקריפט או להשתמש בו, אלא אם כן אתה סומך לחלוטין על המחבר שלו ומבין איך הוא עובד. ייתכן שתמצא גם אלטרנטיבות חינמיות בקוד פתוח בסקריפטים של הקהילה שלנו.