OPEN-SOURCE SCRIPT
Candle Volatility Index [by NicoadW]
This is the migration of the CandleVolatilitIndex from MT4.
The indicator works as following:
Step 1: The "Volatility Value" is calculated by applying a moving average to the change of the selected source (default: 10-Period-SMA applied to the change from last close to this close -> SMA(close-close[1] , 10) )
Step 2: The signal line is calculated by applying a moving average onto the "Volatility Value" calculated in step 1.
The default settings are the same as in the original MT4 version.
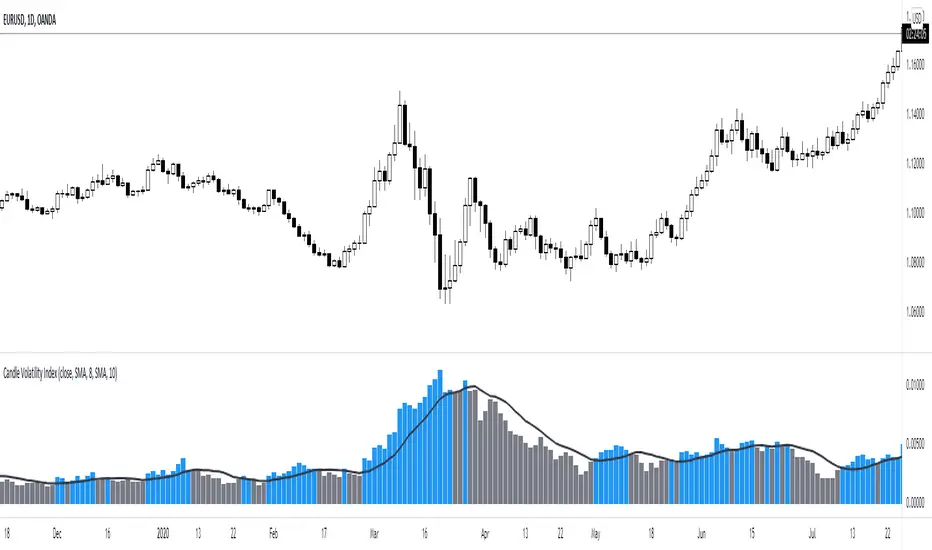
Visualization:
The histogram shows the "Volatility Value" calculated in step 1.
Case 1:
The value is above the signal line (blue bar) -> Volatility is given
Case 2:
The value is below the signal line (grey bar) -> Volatility is not there
This is intended to be used as a Volume/Volatility Indicator for a NNFX-System but can be used in any strategy.
The indicator works as following:
Step 1: The "Volatility Value" is calculated by applying a moving average to the change of the selected source (default: 10-Period-SMA applied to the change from last close to this close -> SMA(close-close[1] , 10) )
Step 2: The signal line is calculated by applying a moving average onto the "Volatility Value" calculated in step 1.
The default settings are the same as in the original MT4 version.
Visualization:
The histogram shows the "Volatility Value" calculated in step 1.
Case 1:
The value is above the signal line (blue bar) -> Volatility is given
Case 2:
The value is below the signal line (grey bar) -> Volatility is not there
This is intended to be used as a Volume/Volatility Indicator for a NNFX-System but can be used in any strategy.
סקריפט קוד פתוח
ברוח האמיתית של TradingView, יוצר הסקריפט הזה הפך אותו לקוד פתוח, כך שסוחרים יוכלו לעיין בו ולאמת את פעולתו. כל הכבוד למחבר! אמנם ניתן להשתמש בו בחינם, אך זכור כי פרסום חוזר של הקוד כפוף ל־כללי הבית שלנו.
כתב ויתור
המידע והפרסומים אינם מיועדים להיות, ואינם מהווים, ייעוץ או המלצה פיננסית, השקעתית, מסחרית או מכל סוג אחר המסופקת או מאושרת על ידי TradingView. קרא עוד ב־תנאי השימוש.