OPEN-SOURCE SCRIPT
מעודכן Expected Z-Scored Price
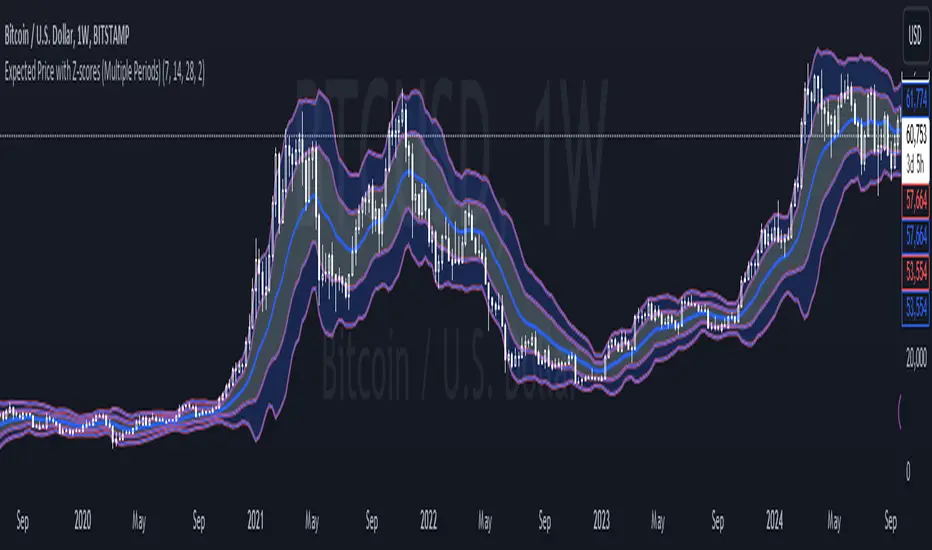
Expected Z-Scored Price is a Mean Reversion based indicator, it shows you where the price should be based on its average price and its average increase over the set previous period, indicating whether the price is under/overvalued giving a unique insight into the current value of an asset, for example  BTCUSD , however is designed for all assets that move in price.
How to read the Expected Z-scored price?
1. Zoom closer, you will see a line in the middle, this is where the price should be based on its average price and its movement
2. The lines above/below are the Standard Deviations (SD) of this expected price, if the price is in the lower price bands or even below them, it is undervalued and it is time to buy/accumulate it, if the price is above the mean (average) price, it is undervalued and should be sold.
It is that easy!
!WATCH OUT!
- This is not a Trend Following indicator, it does not indicate the prices direction, therefore if the asset is undervalued it can still go down, the bands indicate the significancy of the under/overvalueness
- It is not 100% accurate
- Watch out for the significancy of the undervalue or overvalue
Bit more info
- Each line is one SD away from the mean
- Adjusting the timeframe will help you keep the mean and its SDs on the signal period you want them to
- You can adjust the color, thickness of the lines and bands in settings
הערות שחרור
NEW MINI UPDATE!Now one of components of Expected price Z-score is an average of 3 periods, that will be adjustable
סקריפט קוד פתוח
ברוח TradingView אמיתית, היוצר של הסקריפט הזה הפך אותו לקוד פתוח, כך שסוחרים יכולים לבדוק ולאמת את הפונקציונליות שלו. כל הכבוד למחבר! למרות שאתה יכול להשתמש בו בחינם, זכור שפרסום מחדש של הקוד כפוף לכללי הבית שלנו.
כתב ויתור
המידע והפרסומים אינם אמורים להיות, ואינם מהווים, עצות פיננסיות, השקעות, מסחר או סוגים אחרים של עצות או המלצות שסופקו או מאושרים על ידי TradingView. קרא עוד בתנאים וההגבלות.