Gold Spotter
Two “Baskets” of Data
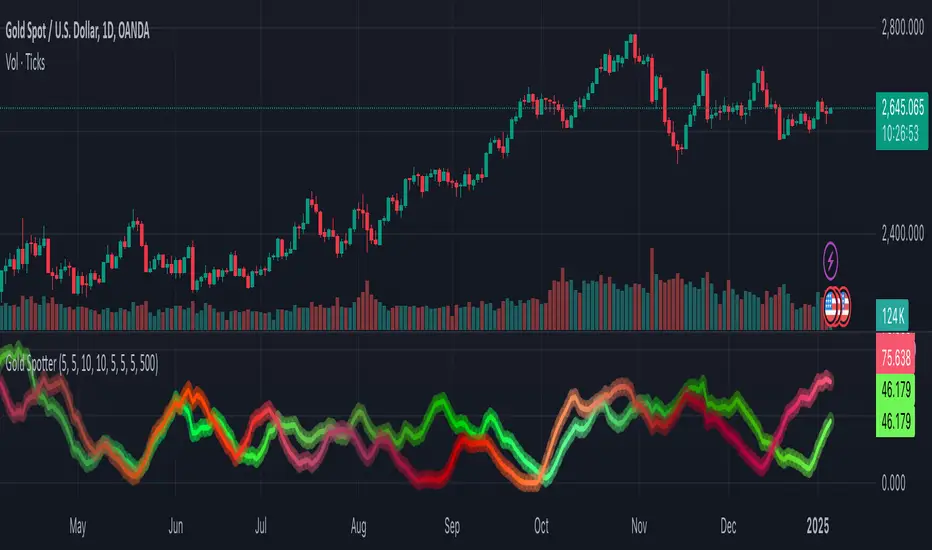
The script constructs two composite values (one green, one red) by fetching certain currency-related data in the background. Each composite is normalized over a lookback period so both lines map into a 0–100 range.
Weighting by Another Security’s Trend
A ratio is calculated from the chart’s own price vs. its moving average. That ratio is raised to a specified “power” (configured by the user), then used to scale each composite. This means if the price is above its average, both lines can be inflated; if below, both lines can be suppressed.
What the Lines Represent
Green Line: Represents a “pegged basket” index. (A small group of instruments that historically move in a certain way relative to Gold.)
Red Line: Represents an “exotics basket” index. (A different group of instruments that also has a meaningful relationship to Gold.)
What Is It Predicting
By measuring hidden relationships between these two baskets and weighting them by the chart’s trend, the green/red lines often provide an early read on which direction Gold might take next usually leading by 3-7 days.
סקריפט להזמנה בלבד
רק משתמשים שאושרו על ידי המחבר יכולים לגשת לסקריפט הזה. יהיה עליך לשלוח בקשת גישה ולקבל אישור לשימוש. בדרך כלל, הגישה ניתנת לאחר תשלום. למידע נוסף, עקוב אחר ההוראות של היוצר בהמשך או צור קשר עם JoeTheGoldTrader ישירות.
שים לב שסקריפט פרטי זה, המוזמן בלבד, לא נבדק על ידי מנהלי סקריפטים, ועמידתו בכללי הבית לא נקבעה. TradingView לא ממליצה לשלם עבור סקריפט או להשתמש בו אלא אם כן אתה סומך לחלוטין על המחבר שלו ומבין כיצד הוא פועל. ייתכן שתוכל גם למצוא חלופות חינמיות וקוד פתוח ב-סקריפטים הקהילתיים שלנו.
הוראות המחבר
כתב ויתור
סקריפט להזמנה בלבד
רק משתמשים שאושרו על ידי המחבר יכולים לגשת לסקריפט הזה. יהיה עליך לשלוח בקשת גישה ולקבל אישור לשימוש. בדרך כלל, הגישה ניתנת לאחר תשלום. למידע נוסף, עקוב אחר ההוראות של היוצר בהמשך או צור קשר עם JoeTheGoldTrader ישירות.
שים לב שסקריפט פרטי זה, המוזמן בלבד, לא נבדק על ידי מנהלי סקריפטים, ועמידתו בכללי הבית לא נקבעה. TradingView לא ממליצה לשלם עבור סקריפט או להשתמש בו אלא אם כן אתה סומך לחלוטין על המחבר שלו ומבין כיצד הוא פועל. ייתכן שתוכל גם למצוא חלופות חינמיות וקוד פתוח ב-סקריפטים הקהילתיים שלנו.