PINE LIBRARY
מעודכן pta_plot
Library "pta_plot"
pta_plot: This library will help you to plot different value. I will keep updating with your requirement
print_array(array_id, border_color)
Display array element as a table.
Parameters:
array_id: Id of your array.
border_color: Color for border (`color.black` is used if no argument is supplied).
Returns: Display array element in bottom of the pane.
הערות שחרור
v2Added:
print_array_float(array_id, border_color)
Display array element as a table.
Parameters:
array_id: Id of your array.
border_color: Color for border (`color.black` is used if no argument is supplied).
Returns: Display array element in bottom of the pane.
print_array_int(array_id, border_color)
Display array element as a table.
Parameters:
array_id: Id of your array.
border_color: Color for border (`color.black` is used if no argument is supplied).
Returns: Display array element in bottom of the pane.
Removed:
print_array(array_id, border_color)
Display array element as a table.
הערות שחרור
v3Added:
print_array_string(array_id, border_color)
Display array element as a table.
Parameters:
array_id: Id of your array.
border_color: Color for border (`color.black` is used if no argument is supplied).
Returns: Display array element in bottom of the pane.
הערות שחרור
v4הערות שחרור
v5Added:
print_array_bool(array_id, border_color)
Display array element as a table.
Parameters:
array_id: Id of your array.
border_color: Color for border (`color.black` is used if no argument is supplied).
Returns: Display array element in bottom of the pane.
הערות שחרור
v6Added:
peakprofit(longcondition, shortcondition)
peakprofit: This function will create a label for max profit in trade range.
Parameters:
longcondition: is a Boolean Value
shortcondition: is a Boolean Value
Returns: peakprofit Create Label on Chart
Instruction: Don't forget to add max_labels_count=500, max_bars_back=500
הערות שחרור
v7Updated:
print_array_float(array_id, position, border_color)
Display array element as a table.
Parameters:
array_id: Id of your array.
position
border_color: Color for border (`color.black` is used if no argument is supplied).
Returns: Display array element in bottom of the pane.
print_array_int(array_id, position, border_color)
Display array element as a table.
Parameters:
array_id: Id of your array.
position: Position of Table
border_color: Color for border (`color.black` is used if no argument is supplied).
Returns: Display array element in bottom of the pane.
print_array_string(array_id, position, border_color)
Display array element as a table.
Parameters:
array_id: Id of your array.
position: Position of Table
border_color: Color for border (`color.black` is used if no argument is supplied).
Returns: Display array element in bottom of the pane.
print_array_bool(array_id, position, border_color)
Display array element as a table.
Parameters:
array_id: Id of your array.
position: Position of Table
border_color: Color for border (`color.black` is used if no argument is supplied).
Returns: Display array element in bottom of the pane.
Removed:
peakprofit(longcondition, shortcondition)
peakprofit: This function will create a label for max profit in trade range.
הערות שחרור
v8Added:
calcCPR(High, Low, Close)
Return CPR.
Parameters:
High (float)
Low (float)
Close (float)
Returns: CPR Value as Tuple [pp, tc, bc, r1, r2, r3, r4, s1, s2, s3, s4].
הערות שחרור
Version 9 Updates:- `dll` function:
- Function's purpose : Plot a horizontal line and label at a specified price level on the chart.
- Parameters:
- Price (float): The Y value for the line and label.
- Text (string): The text to display alongside the label.
- Color (color): The color for the line and label text.
- Width (int, default=1): The width of the line.
- LineStyle (string, default=line.style_solid): The style of the line.
- Historical (bool, default=false): If true, the line and label will appear on historical chart data.
- Returns: Displays a horizontal line and label on the chart.
- Motive: Enhances readability and usability by providing a function for plotting customizable lines and labels on charts.
הערות שחרור
v10- `dll` function updated:
- Function's purpose : Plot a horizontal line and label at a specified price level on the chart.
- Parameters:
- Price (float): The Y value for the line and label.
- Text (string): The text to display alongside the label.
- Color (color): The color for the line and label text.
- Width (int, default=1): The width of the line.
- LineStyle (string, default=line.style_solid): The style of the line.
- Historical (bool, default=false): If true, the line and label will appear on historical chart data.
- Returns: Displays a horizontal line and label on the chart.
- Motive: Enhances readability and usability by providing a function for plotting customizable lines and labels on charts.
הערות שחרור
v11Updated:
dll(Price, Text, barCount, Color, Width, LineStyle, Historical)
Parameters:
Price (float)
Text (string)
barCount (int)
Color (color)
Width (int)
LineStyle (string)
Historical (bool)
הערות שחרור
v12Added:
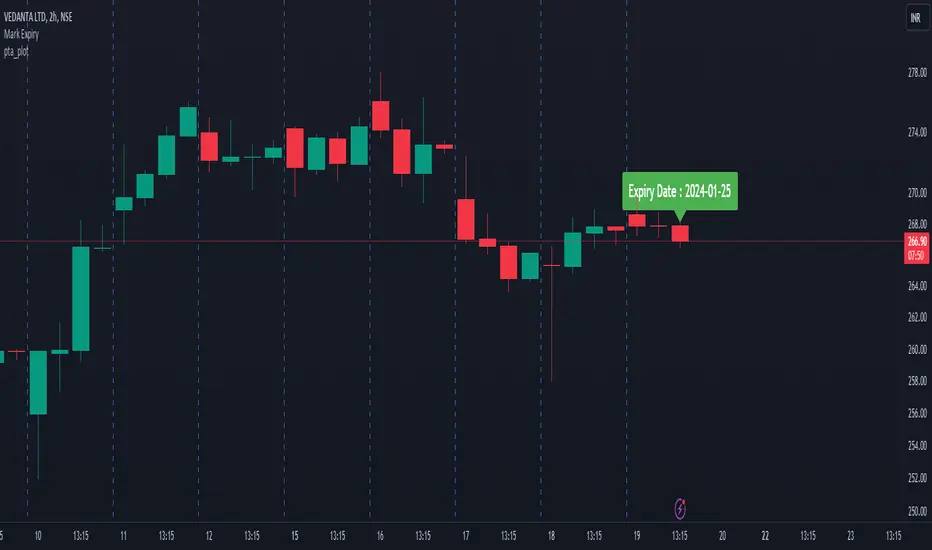
getExpiry(expiryType, expiryDay, changeExpiry, format)
Parameters:
expiryType (string)
expiryDay (string)
changeExpiry (int)
format (string)
ספריית Pine
ברוח האמיתית של TradingView, המחבר לפרסם את הקוד של Pine הזה כספרייה בקוד פתוח, כך שמתכנתים אחרים בקהילתנו יעשו שימוש חוזר. כל הכבוד למחבר! ניתן להשתמש בספרייה הזו באופן פרטי או בומים בקוד פתוח, אך השימוש בחוזר בקוד הזה בפרסומים כפוף ל-כללי הבית.
כתב ויתור
המידע והפרסומים אינם מיועדים להיות, ואינם מהווים, ייעוץ או המלצה פיננסית, השקעתית, מסחרית או מכל סוג אחר המסופקת או מאושרת על ידי TradingView. קרא עוד ב־תנאי השימוש.