PROTECTED SOURCE SCRIPT
Trend Momentum - Tradingriot
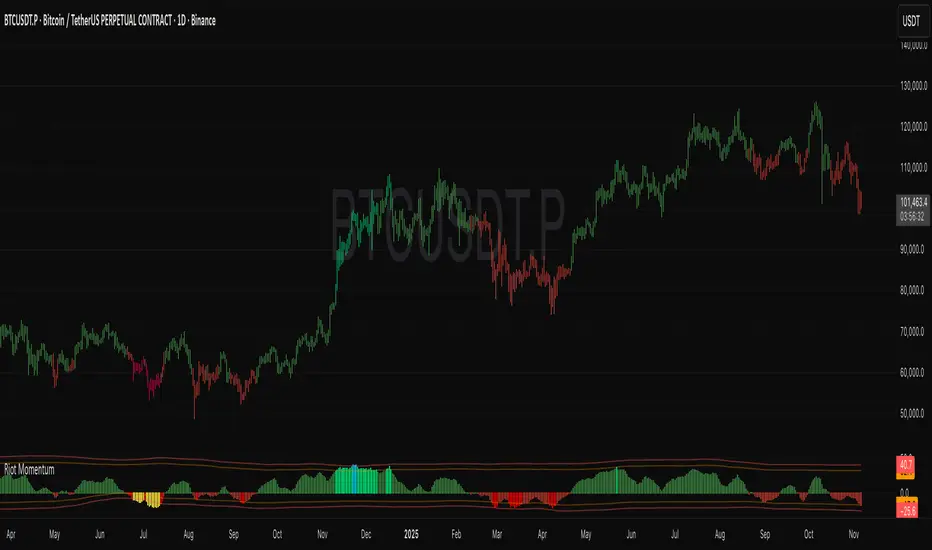
Riot Momentum blends three robust and momentum components into one normalized oscillator built for daily trend identification:
Inspired by Advanced Futures Trading Strategies book by Robert Carver
1. EWMAC Trend (8/32, 16/64, 32/128)
Three exponential moving-average crossover pairs, normalized by realized volatility. This captures fast, medium, and slow trend behavior. Signals are smoothed through ensemble averaging.
2. Breakout Trend (20, 40, 80-day)
Classic Donchian-style breakout logic. The script measures where price sits inside its rolling range, scales it to a forecast value, and smooths it based on Carver’s recommended span. This captures structural market shifts that EMAs miss.
3. Acceleration / ROC Shift
Short-term rate-of-change of momentum, normalized by volatility. This highlights inflection points and early trend transitions.
The three systems are combined with fixed weights and clipped to a ±20 forecast cap. The final value is rescaled to a ±100 histogram for intuitive reading.
Z-Score Regime Framework
The combined momentum is wrapped in a statistical regime filter using a rolling Z-score:
Normal: |Z| < 1.5
Elevated: 1.5 ≤ |Z| < 2.0
Peak: |Z| ≥ 2.0
The histogram automatically adapts its color based on:
Signal direction (long vs short)
Z-score regime (normal, elevated, peak)
This gives immediate context: not only what the trend is, but how statistically stretched it is relative to the past year.
Optional Z-score bands and mean line help visualize regime behavior over time.
Candle Coloring
Bars can optionally take on the histogram’s regime-aware coloring, making full-chart trend state obvious at a glance.
Alerts
Built-in alerts:
Momentum turning long
Momentum turning short
Z-score reaching peak extremes
Z-score reverting back toward normal
How to Use
This is a multi-factor trend filter, not a trade-entry generator. It excels at:
Trend following
Regime classification
Identifying exhaustion/extremes
Filtering whipsaw environments
Portfolio rotation and timing models
Use the histogram direction for high-level trend bias. Use the Z-score color transitions to gauge stretch and mean-reversion risk.
סקריפט מוגן
סקריפט זה פורסם כמקור סגור. עם זאת, אתה יכול להשתמש בו באופן חופשי וללא כל הגבלה - למד עוד כאן.
כתב ויתור
המידע והפרסומים אינם אמורים להיות, ואינם מהווים, עצות פיננסיות, השקעות, מסחר או סוגים אחרים של עצות או המלצות שסופקו או מאושרים על ידי TradingView. קרא עוד בתנאים וההגבלות.
סקריפט מוגן
סקריפט זה פורסם כמקור סגור. עם זאת, אתה יכול להשתמש בו באופן חופשי וללא כל הגבלה - למד עוד כאן.
כתב ויתור
המידע והפרסומים אינם אמורים להיות, ואינם מהווים, עצות פיננסיות, השקעות, מסחר או סוגים אחרים של עצות או המלצות שסופקו או מאושרים על ידי TradingView. קרא עוד בתנאים וההגבלות.