INVITE-ONLY SCRIPT
Executer

Executer helps to be a disciplined trader by providing the rules for execution.
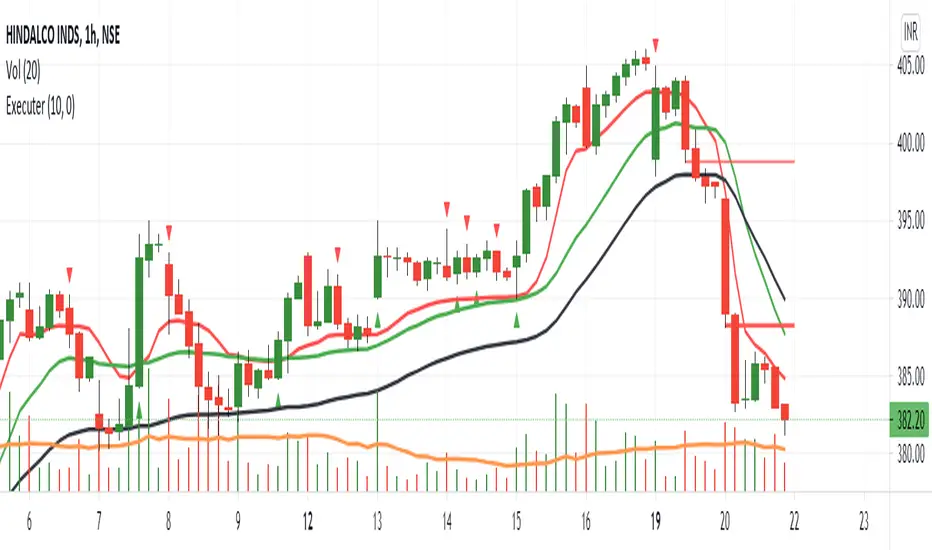
1. Triangle down and up symbol : One can consider this as 1st point of confirmation. This considers the volume and momentum.
2. Moving average band ( To identify the trend ) : When the red line is above all the other lines means trend is up or positive, so buy only when trend is UP.
Red line is below all other line means Trend is negative or Down, consider always to sell when trend is negative.
When redline is between green and black then trend is sideways or you may expect a big move and risk to reward ratio will be better in this type of setup.
When the red line is up then black line acts as Stop loss point.
3. Horizontal lines : Dynamic horizontal lines acts as booster to the trend or safe buying or selling point. This analyze the trend, candle strength and momentum to give the buying point or selling point. Here 1st thin line shows the start of trend and thick line shows the strong trend. Lines get deleted when the buying or selling point is invalid or one may consider the fresh points.
This helps to eliminate lot of sideways trends.
This indicator is fully customizable based on your requirement.
Consider more signal option if you don't want to miss the opportunity. If you are safe trader then no need of that.
סקריפט להזמנה בלבד
הגישה לסקריפט זה מוגבלת למשתמשים שהוסמכו על ידי הכותב ובדרך כלל דורשת תשלום. אתה יכול להוסיף אותו למועדפים שלך, אך תוכל להשתמש בו רק לאחר שתבקש אישור ותקבל אותו מהמחבר שלו. למידע נוסף, צור קשר עם SupplyIsInDemand, או עקוב אחר הוראות המחבר למטה.
TradingView לא מציעה לשלם עבור סקריפט ולהשתמש בו אלא אם כן אתה סומך ב-100% על המחבר שלו ומבין כיצד הסקריפט עובד. במקרים רבים, אתה יכול למצוא אלטרנטיבה טובה לקוד פתוח בחינם בבסקריפטים הקהילתיים שלנו.
הוראות המחבר
″DM me for more information.
רוצה להשתמש בסקריפ זה בגרף?
אזהרה: נא לקרוא לפני בקשת גישה.
כתב ויתור
המידע והפרסומים אינם אמורים להיות, ואינם מהווים, עצות פיננסיות, השקעות, מסחר או סוגים אחרים של עצות או המלצות שסופקו או מאושרים על ידי TradingView. קרא עוד בתנאים וההגבלות.