PROTECTED SOURCE SCRIPT
HPT - Heikin-Ashi Price Tool
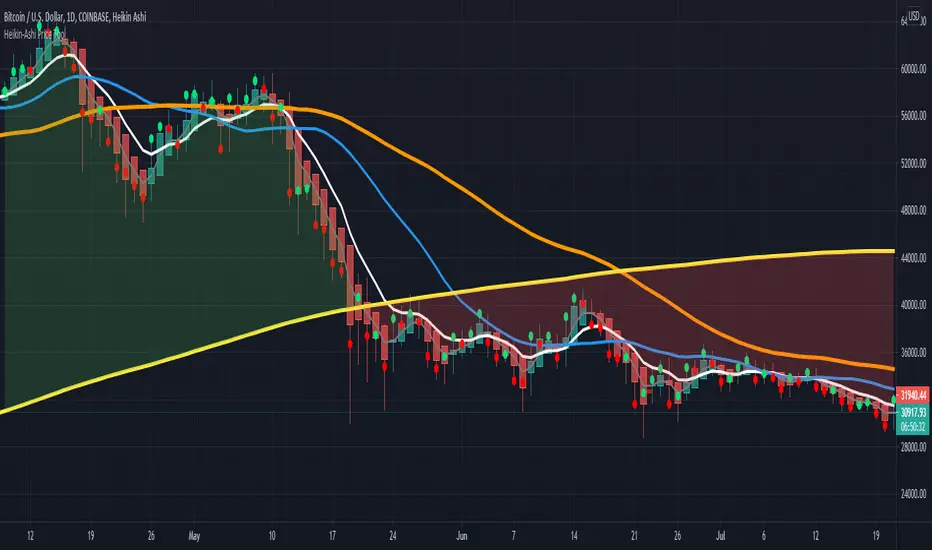
This overlay study can be used with an Heikin-Ashi chart and diplays the real prices for Heikin-Ashi candles as circles for each bar. If the real closing price of the bar is higher then the opening price, the circle has a green color, otherwise it is red.
Here you can see the overlay : BTCUSD
The follwing moving averages are added to the chart as well: SMA 20, 50, 200 and EMA 8 (for analyzing trend and support/resistance ). A background fill can be activated for the overall trend.
I recommend to lower the opacity for the bars so that you can better see the circles for the real prices.
Here you can see the overlay :
The follwing moving averages are added to the chart as well: SMA 20, 50, 200 and EMA 8 (for analyzing trend and support/resistance ). A background fill can be activated for the overall trend.
I recommend to lower the opacity for the bars so that you can better see the circles for the real prices.
סקריפט מוגן
סקריפט זה פורסם כמקור סגור. עם זאת, תוכל להשתמש בו בחופשיות וללא כל מגבלות – למד עוד כאן
Access our indicators from: indivisionx.com
כתב ויתור
המידע והפרסומים אינם מיועדים להיות, ואינם מהווים, ייעוץ או המלצה פיננסית, השקעתית, מסחרית או מכל סוג אחר המסופקת או מאושרת על ידי TradingView. קרא עוד ב־תנאי השימוש.