OPEN-SOURCE SCRIPT
GLD GC Price Converter

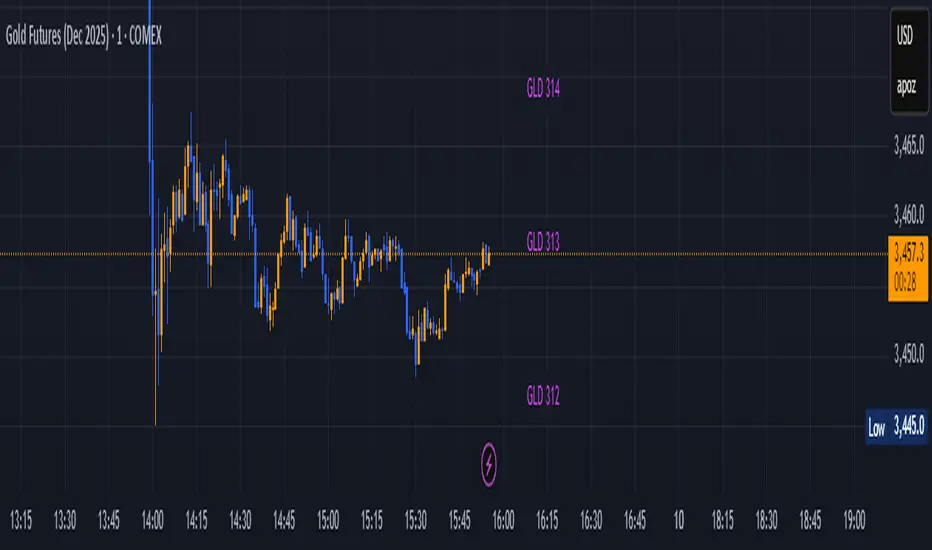
Its primary function is to fetch the prices of the Gold ETF (ticker: GLD) and Gold Futures (ticker: GC1!) and then project significant price levels from one or both of these assets onto the chart of whatever instrument you are currently viewing.
Core Functionality & Features
Dual Asset Tracking: The script simultaneously tracks the prices of GLD and Gold Futures (GC).
Dynamic Price Level Projection: The script's main feature is its ability to calculate and draw horizontal price levels. It determines a "base price" (e.g., the nearest $100 level for GC) and then draws lines at specified increments above and below it. The key is that these levels are projected onto the current chart's price scale.
On-Chart Information Display:
Price Table: A customizable table can be displayed in any corner of the chart, showing the current prices of GLD and GC. It can also show the daily percentage change for GC, colored green for positive changes and red for negative ones.
Last Price Label: It can show a label next to the most recent price bar that displays the current prices of both GLD and GC.
Extensive Customization: The user has significant control over the indicator's appearance and behavior through the settings panel.
This includes:
Toggling the display for GLD and GC levels independently.
Adjusting the multiplier for the price levels (e.g., show levels every $100 or $50 for GC).
Changing the colors, line styles (solid, dashed, dotted), and horizontal offset for the labels.
Defining the number of price levels to display.
Controlling the text size for labels and the table.
Choosing whether the script updates on every tick or only once per candle close for better performance.
סקריפט קוד פתוח
ברוח האמיתית של TradingView, יוצר הסקריפט הזה הפך אותו לקוד פתוח, כך שסוחרים יוכלו לעיין בו ולאמת את פעולתו. כל הכבוד למחבר! אמנם ניתן להשתמש בו בחינם, אך זכור כי פרסום חוזר של הקוד כפוף ל־כללי הבית שלנו.
כתב ויתור
המידע והפרסומים אינם מיועדים להיות, ואינם מהווים, ייעוץ או המלצה פיננסית, השקעתית, מסחרית או מכל סוג אחר המסופקת או מאושרת על ידי TradingView. קרא עוד ב־תנאי השימוש.