INVITE-ONLY SCRIPT
ATR Exhaustion
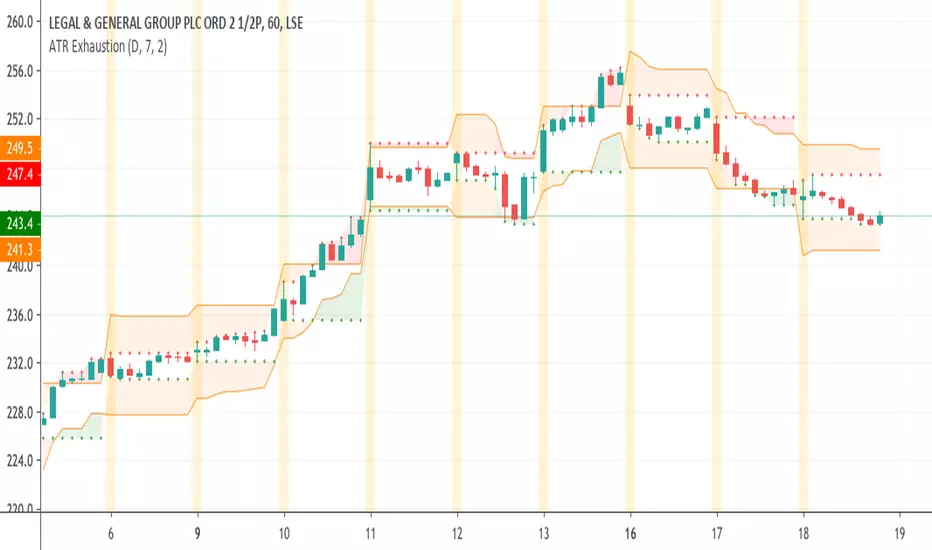
The ATR Exhaustion indicator for Tradingview will overlay the minimum and maximum price limits for a timeframe over your chart. It calculates the price limits be adding and subtracting the ATR level from the high and lows of the period you are interested in.
For example, you can see the daily upper and lower ATR levels whilst on a 15-minute chart. The upper and lower ranges will update as price moves.
Why would this be useful?
It the true price range on average does not move more than x pips/points, then the range boundaries might provide support/resistance levels as price approaches the levels. Additionally, you can use this tool to easily identify how volatile price action has been in comparison to previous periods.
Features
- Easily see ATR Exhaustion areas in any timeframe
- Period highs and lows are plotted and updated as price action unfolds
- Color fills change when price moves beyond the ATR range for easy identification of periods of strong trends or volatility.
סקריפט להזמנה בלבד
הגישה לסקריפט זה מוגבלת למשתמשים שהוסמכו על ידי הכותב ובדרך כלל דורשת תשלום. אתה יכול להוסיף אותו למועדפים שלך, אך תוכל להשתמש בו רק לאחר שתבקש אישור ותקבל אותו מהמחבר שלו. למידע נוסף, צור קשר עם BacktestRookies, או עקוב אחר הוראות המחבר למטה.
TradingView לא מציעה לשלם עבור סקריפט ולהשתמש בו אלא אם כן אתה סומך ב-100% על המחבר שלו ומבין כיצד הסקריפט עובד. במקרים רבים, אתה יכול למצוא אלטרנטיבה טובה לקוד פתוח בחינם בבסקריפטים הקהילתיים שלנו.
הוראות המחבר
″
רוצה להשתמש בסקריפ זה בגרף?
אזהרה: נא לקרוא לפני בקשת גישה.
כתב ויתור
המידע והפרסומים אינם אמורים להיות, ואינם מהווים, עצות פיננסיות, השקעות, מסחר או סוגים אחרים של עצות או המלצות שסופקו או מאושרים על ידי TradingView. קרא עוד בתנאים וההגבלות.