OPEN-SOURCE SCRIPT
Katik Cycle 56 Days
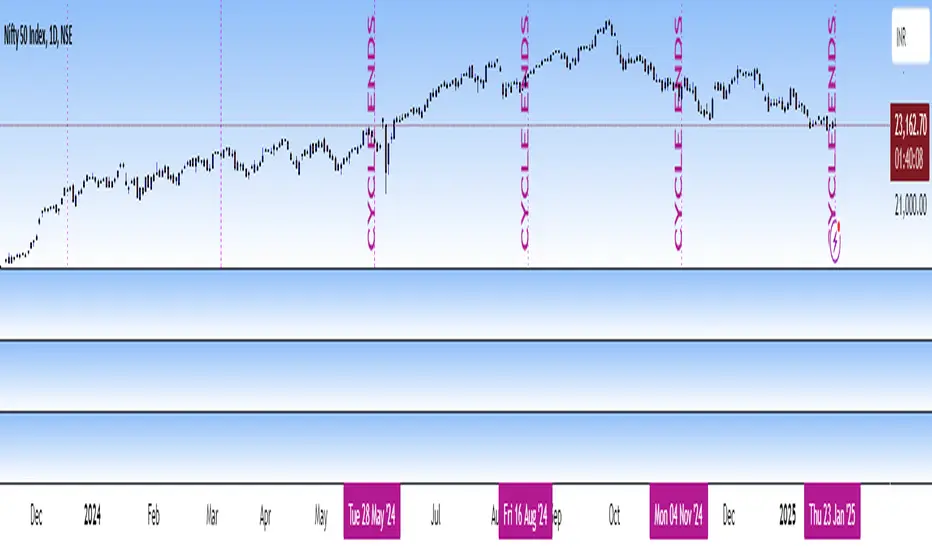
This script plots vertical dotted lines on the chart every 56 trading days, starting from the first bar. It calculates intervals based on the bar_index and draws the lines for both historical and future dates by projecting the lines forward.
The lines are extended across the entire chart height using extend=extend.both, ensuring visibility regardless of chart zoom level. You can customize the interval length using the input box.
Note: Use this only for 1D (Day) candle so that you can find the changes in the trend...
The lines are extended across the entire chart height using extend=extend.both, ensuring visibility regardless of chart zoom level. You can customize the interval length using the input box.
Note: Use this only for 1D (Day) candle so that you can find the changes in the trend...
סקריפט קוד פתוח
ברוח האמיתית של TradingView, יוצר הסקריפט הזה הפך אותו לקוד פתוח, כך שסוחרים יוכלו לעיין בו ולאמת את פעולתו. כל הכבוד למחבר! אמנם ניתן להשתמש בו בחינם, אך זכור כי פרסום חוזר של הקוד כפוף ל־כללי הבית שלנו.
כתב ויתור
המידע והפרסומים אינם מיועדים להיות, ואינם מהווים, ייעוץ או המלצה פיננסית, השקעתית, מסחרית או מכל סוג אחר המסופקת או מאושרת על ידי TradingView. קרא עוד ב־תנאי השימוש.