PROTECTED SOURCE SCRIPT
Hikaru Bands
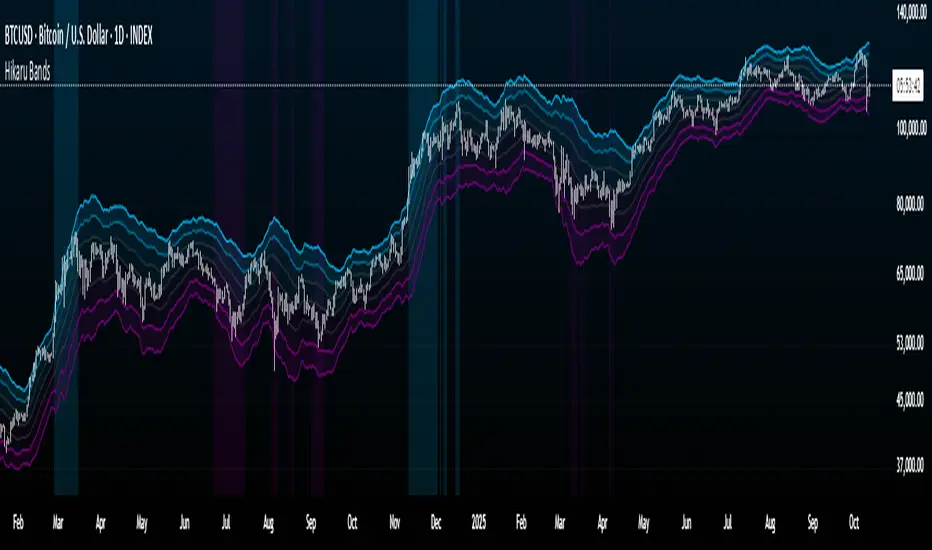
Hikaru Bands is a volatility indicator designed to provide a view of market dynamics. Unlike traditional banding tools like Bollinger Bands, which rely solely on standard deviation, Hikaru Bands incorporate a Composite Volatility Index (UVI). This index is built from a customizable blend of up to ten different technical indicators, including momentum, trend, and risk metrics.
Core Concept & Calculation
The script first calculates the values of up to ten different technical indicators, which you can enable or disable individually. These include RSI, CCI, Sharpe Ratio, Omega Ratio, Z-Score, Rate of Change (ROC), and more. Each selected indicator's output is then normalized into a percentile rank (a scale of 0-100) to ensure they can be compared and combined effectively. Finally, the normalized values are weighted and averaged to create a single Universal Volatility Index (UVI). A high UVI suggests strong bullish momentum and volatility/overbought, while a low UVI suggests strong bearish momentum/oversold.
How to Use & Interpretation
Interpreting the bands is intuitive and provides multiple layers of analysis:
Extreme Bands (Outer Bands): When the price touches or exceeds these bands, it suggests a potential exhaustion point or a climax in the current trend. These are often areas to watch for potential reversals or pullbacks.
Warning Bands: These act as an early signal that momentum is becoming stretched. Price action within this zone indicates a strong trend that may be approaching overbought or oversold territory.
Neutral Bands: The area between these bands and the basis line represents typical price action. When the price remains within this zone, it often signals a consolidating or ranging market.
Features & Customization
This script offers extensive customization to tailor the indicator to your specific needs and analysis style:
Modular Component Selection: Individually enable or disable any of the ten underlying indicators to build your own custom UVI. You can also adjust the weight of each component to give more importance to the indicators you trust most.
Detailed Parameter Control: Fine-tune the settings for each individual indicator, such as the period for RSI, the lookback for the Sharpe Ratio, or the fast/slow lengths for the EMA Spread.
Visuals: Comes with eight built-in color schemes (including Classic, Neon, and Ocean) to match your chart's aesthetic.
Band Smoothing: Apply an optional smoothing filter to the bands and the basis line to reduce noise and focus on the underlying trend.
Disclaimer
This tool is designed for technical analysis and should not be used as a standalone signal for trading. The effectiveness of the bands depends on the selected components and market conditions. Always use this indicator in conjunction with other forms of analysis and a robust risk management strategy.
סקריפט מוגן
סקריפט זה פורסם כמקור סגור. עם זאת, תוכל להשתמש בו בחופשיות וללא כל מגבלות – למד עוד כאן
כתב ויתור
המידע והפרסומים אינם מיועדים להיות, ואינם מהווים, ייעוץ או המלצה פיננסית, השקעתית, מסחרית או מכל סוג אחר המסופקת או מאושרת על ידי TradingView. קרא עוד ב־תנאי השימוש.
סקריפט מוגן
סקריפט זה פורסם כמקור סגור. עם זאת, תוכל להשתמש בו בחופשיות וללא כל מגבלות – למד עוד כאן
כתב ויתור
המידע והפרסומים אינם מיועדים להיות, ואינם מהווים, ייעוץ או המלצה פיננסית, השקעתית, מסחרית או מכל סוג אחר המסופקת או מאושרת על ידי TradingView. קרא עוד ב־תנאי השימוש.