OPEN-SOURCE SCRIPT
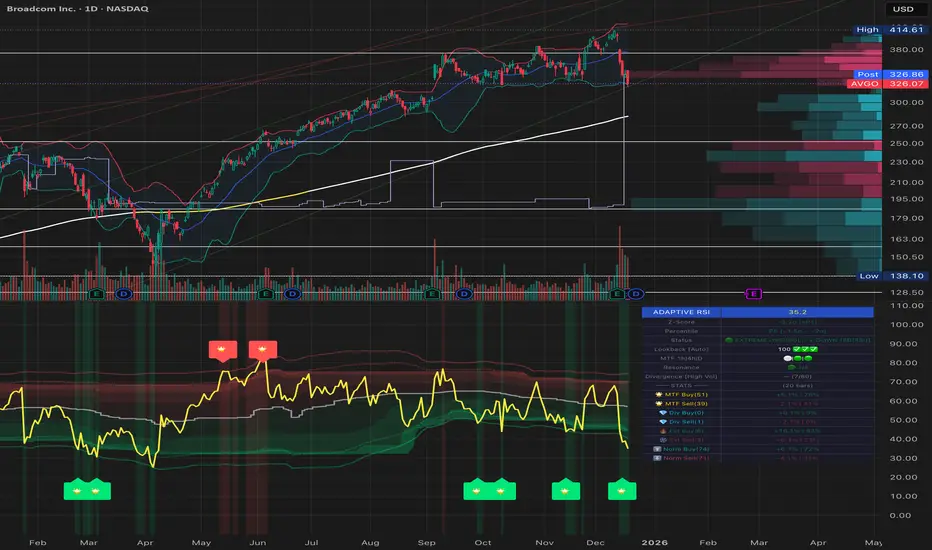
Adaptive RSI Pro
# Adaptive RSI Pro / 自适应RSI专业版
[](https://www.tradingview.com/scripts/)
[](https://www.tradingview.com/pine-script-reference/v6/)
[](https://opensource.org/licenses/MIT)
Dynamic overbought/oversold thresholds + Multi-Timeframe analysis + Divergence detection + Signal statistics.
根据每个标的实际历史分布动态计算超买/超卖阈值,结合多时间框架分析、背离检测和信号统计。
**Pine Script v6** | **Last Update: 2025-12-17** | **v6.2**
---
## Emoji Legend / 信号图例
### Chart Signals / 图表信号
#### Buy Signals / 买入信号 (底部显示)
| Emoji | Signal Name | Condition | Priority | Action |
|-------|-------------|-----------|----------|--------|
| 🌟 | MTF + Extreme | 3+ timeframes oversold + Z<−2σ | ★★★★★ | **STRONG BUY** 强力买入 |
| 💎 | Divergence + Extreme | Bullish divergence in Z<−2σ zone | ★★★★☆ | **BUY** 买入 |
| 🔥 | Extreme Oversold | Z-Score crosses below −2σ (≈P2) | ★★★☆☆ | **BUY** 买入 |
| ⬆️ | Normal Oversold | Z-Score crosses below −1.5σ (≈P7) | ★★☆☆☆ | Consider buy 考虑买入 (默认隐藏) |
| ↗️ | Bullish Divergence | Price↓ RSI↑ (not in extreme zone) | ★☆☆☆☆ | Watch 观察 (潜在底部) |
#### Sell Signals / 卖出信号 (顶部显示)
| Emoji | Signal Name | Condition | Priority | Action |
|-------|-------------|-----------|----------|--------|
| 🌟 | MTF + Extreme | 3+ timeframes overbought + Z>+2σ | ★★★★★ | **STRONG SELL** 强力卖出 |
| 💎 | Divergence + Extreme | Bearish divergence in Z>+2σ zone | ★★★★☆ | **SELL** 卖出 |
| ❄️ | Extreme Overbought | Z-Score crosses above +2σ (≈P98) | ★★★☆☆ | **SELL** 卖出 |
| ⬇️ | Normal Overbought | Z-Score crosses above +1.5σ (≈P93) | ★★☆☆☆ | Consider sell 考虑卖出 (默认隐藏) |
| ↘️ | Bearish Divergence | Price↑ RSI↓ (not in extreme zone) | ★☆☆☆☆ | Watch 观察 (潜在顶部) |
> **Priority System / 优先级系统**: Only the highest priority signal is shown to prevent overlapping.
> 只显示最高优先级信号,避免叠加。
---
### Dashboard Status / 仪表盘状态
| Emoji | Status | Meaning |
|-------|--------|---------|
| 🟢 | EXTREME OVERSOLD | Z-Score < −2σ (≈P2.3), strong buy zone / 极端超卖区,强买区 |
| 🟡 | OVERSOLD | Z-Score < −1.5σ (≈P6.7), oversold / 超卖 |
| ⚪ | NEUTRAL | −1.5σ ≤ Z-Score ≤ +1.5σ, no signal / 中性,无信号 |
| 🟠 | OVERBOUGHT | Z-Score > +1.5σ (≈P93.3), overbought / 超买 |
| 🔴 | EXTREME OVERBOUGHT | Z-Score > +2σ (≈P97.7), strong sell zone / 极端超买区,强卖区 |
### MTF Status / 多周期状态
| Emoji | Meaning |
|-------|---------|
| 🟢 | Timeframe oversold / 该周期超卖 |
| 🔴 | Timeframe overbought / 该周期超买 |
| ⚪ | Timeframe neutral / 该周期中性 |
### Divergence Status / 背离状态
| Emoji | Meaning |
|-------|---------|
| 🟢 BULL DIV | Bullish divergence detected / 检测到看涨背离 |
| 🔴 BEAR DIV | Bearish divergence detected / 检测到看跌背离 |
| — | No divergence / 无背离 |
---
### Alert Emojis / 警报图标
| Emoji | Alert Type | Description |
|-------|------------|-------------|
| 🎯 | Smart Alert | V6 Unified Alert System / V6统一警报系统 |
---
## Overview / 概述
Traditional RSI uses fixed 30/70 thresholds, but different assets have different volatility characteristics.
传统RSI使用固定的30/70阈值,但不同标的有不同的波动特性。
**Solution**: Calculate thresholds using historical percentiles (P5-P95) + advanced features.
**解决方案**:使用历史百分位(P5-P95)计算阈值 + 高级功能。
---
## Features / 功能特性
### 🎯 Adaptive Thresholds / 自适应阈值
- **Z-Score Based Signals**: Uses statistical Z-Score (±2σ for extreme, ±1.5σ for normal) for consistent cross-asset performance
使用统计Z-Score(极端±2σ,普通±1.5σ)实现跨资产一致性
- **Percentile Lines**: Display P5/P10/P25/P50/P75/P90/P95 for visual reference
百分位线(P5-P95)作为视觉参考
- **Dual Display Modes**: Show Z-Score lines, Percentile lines, or both
双重显示模式:可选择显示Z值线、百分位线或两者
### 🔬 Auto-Adaptive Lookback / 自动自适应回看期
- **Statistical Formula**: Uses `n = (Z × σ / E)²` for optimal sample size calculation
统计公式:使用样本量公式自动计算最优回看期
- **Dual Volatility System**: Combines short-term (4× RSI length) and long-term volatility (configurable: 6M/1Y/2Y)
双重波动率系统:结合短期和长期波动率动态调整
- **Precision Control**: Choose High/Normal/Low precision (adjusts acceptable error margin)
精度控制:高/普通/低精度可选(调整统计误差容忍度)
- **Health Indicators**: Real-time validation of sample coverage, distribution spread, and statistical validity
健康度指标:实时验证样本覆盖率、分布宽度和统计有效性
### 📈 Auto-Adaptive Trend Filter / 自动自适应趋势过滤
- **Auto Mode**: Automatically selects optimal filter based on RSI volatility percentiles
自动模式:根据RSI波动率百分位自动选择最优过滤器
- **5 Filter Modes**: Fixed 50, Adaptive P50, SMA(RSI), BB(RSI), or Auto
5种过滤模式:固定50、自适应P50、RSI均线、布林带或自动
- **Smart Selection**: Low volatility → Fixed 50, Medium → Adaptive P50, High → BB(RSI)
智能选择:低波动→固定50,中波动→自适应P50,高波动→布林带
### 🌍 Multi-Timeframe RSI / 多时间框架RSI
- **3 Configurable Timeframes**: View RSI status across multiple timeframes (default: 1h/4h/D)
3个可配置时间框架:跨周期查看RSI状态(默认:1小时/4小时/日线)
- **Auto-Skip Duplicates**: Automatically detects and skips timeframes matching current chart
自动跳过重复:自动检测并跳过与当前图表相同的时间框架
- **Resonance Detection**: Triggers when 3+ valid timeframes agree (oversold/overbought)
共振检测:当3个以上有效时间框架一致时触发强信号
> [!NOTE]
> **MTF Signal Confirmation Timing / 信号确认时机**
>
> - Current timeframe signals update in real-time, confirmed on bar close
> - Higher timeframe signals (e.g., Daily on 1H chart) only update after that timeframe's bar closes
> - **Best Practice**: Wait for current timeframe bar close before acting on MTF resonance signals
>
> - 当前图表周期的信号:实时更新,K线收盘确认
> - 高周期信号(如日线):仅在该周期K线收盘后更新
> - **最佳实践**:MTF共振信号建议在当前周期K线收盘后再做交易决策
### 💎 Auto-Adaptive Divergence Detection / 自动自适应背离检测
- **Auto Mode**: Automatically selects parameters based on asset volatility (using ATR)
自动模式:基于资产波动率(ATR)自动选择参数
- **4 Preset Modes**: Low Vol (3/40), Normal (5/60), High Vol (7/80), Crypto (10/120)
4种预设模式:低波动/普通/高波动/加密货币,分别对应不同的回看/范围参数
- **Extreme Zone Detection**: Distinguishes divergence in extreme zones (💎) vs normal zones (↗️↘️)
极端区域检测:区分极端区域背离(💎)和普通背离(↗️↘️)
- **Bullish/Bearish Divergence**: Price lower low + RSI higher low / Price higher high + RSI lower high
看涨/看跌背离:价格新低+RSI未新低 / 价格新高+RSI未新高
### 📊 Layered Signal Statistics / 分层信号统计
- **4-Tier Classification**: MTF Resonance (🌟) > Divergence+Extreme (💎) > Extreme Only (🔥❄️) > Normal (⬆️⬇️)
四层分级:多周期共振 > 背离+极端 > 仅极端 > 普通信号
- **Independent Tracking**: Each signal tier has separate count, average return, and win rate
独立跟踪:每层信号独立统计次数、平均收益、胜率
- **Signal Cooldown**: Optional cooldown period (default 5 bars) to prevent duplicate counting
信号冷却:可选冷却期(默认5根K线)防止重复计数
- **Real Forward Testing**: Calculates actual returns N bars after signal (configurable 5-100 bars)
真实前瞻测试:计算信号后N根K线的实际收益(可配置5-100)
---
## Z-Score 与 百分位:双重视角 / Dual Perspective
This indicator displays **both Z-Score and Percentile** to provide complementary views of the same RSI distribution.
本指标**同时显示Z-Score和百分位**,为同一RSI分布提供互补视角。
### Why Both? / 为什么同时显示?
**Fundamental Connection / 本质关联**:
两者都是描述RSI在历史分布中位置的统计方法。
Both are statistical methods describing RSI's position in historical distribution.
- **Z-Score(标准分数)**: `(RSI - 均值) / 标准差` - 基于正态分布假设
Based on normal distribution assumption.
- **百分位(Percentile)**: RSI在历史数据中的排名位置 - 不假设分布类型
RSI's ranking position in historical data - no distribution assumption.
**Complementary Advantages / 互补优势**:
| Dimension 维度 | Z-Score | Percentile 百分位 |
|------|---------|------------|
| **Cross-asset Consistency / 跨资产一致性** | ✅ Excellent 优秀 - BTC和SPY都用±2σ | ⚠️ Varies by volatility 因波动率不同而异 |
| **Statistical Rigor / 统计学严谨性** | ✅ Confidence intervals 置信区间、假设检验 | ⚠️ Non-parametric 非参数统计 |
| **Intuitive / 直观易懂** | ⚠️ Stats knowledge needed 需要统计学知识 | ✅ "Below 95% of history" "低于95%历史值" |
| **Use Case / 适用场景** | 📊 Quant backtesting 量化回测、信号触发 | 📈 Visualization 可视化、用户理解 |
### Conversion Reference / 转换对照表
**Quick Reference / 快速对照**(Assuming normal distribution / 假设正态分布):
| Z-Score | Percentile 百分位 | Meaning 含义 | Signal 信号类型 |
|---------|--------|---------------|----------|
| **±2.5σ** | **P0.6 / P99.4** | Extreme anomaly (outside 99% CI) / 极端异常(99%置信区间外) | Rare opportunity 罕见机会 |
| **±2.0σ** | **P2.3 / P97.7** | Extreme OB/OS (outside 95% CI) / 极端超买/超卖(95%置信区间外) | 🔥❄️ Extreme 极端信号 |
| ±1.5σ | P6.7 / P93.3 | Notable deviation / 显著偏离 | ⬆️⬇️ Normal 普通信号(默认) |
| ±1.0σ | P15.9 / P84.1 | Mildly strong/weak / 轻度偏强/偏弱 | — |
| 0σ | P50 | Median / 中位数 | — |
### Dashboard Dual Display / 仪表盘双重显示
**新版Dashboard已实现自动转换**:
```
┌─────────────────────────────────┐
│ ADAPTIVE RSI PRO 28.5 │
├─────────────────────────────────┤
│ Z-Score −2.15σ (≈P2) │ ← Z值 + 近似百分位
│ Percentile P5 (−1.5σ ~ −2σ) │ ← 百分位 + 对应Z值范围
│ Status 🟢 EXTREME OVERSOLD │
└─────────────────────────────────┘
```
**理解方式**:
- **从Z值看**:−2.15σ 表示超过95%置信区间,统计异常 → 对应约P2
- **从百分位看**:P5 表示低于95%历史值,极端超卖 → 对应约−1.5σ到−2σ之间
### Threshold Line Modes / 阈值线模式
**Unified Mode (Recommended) / Unified模式(推荐)** - Balances rigor and intuitiveness / 兼顾严谨性和直观性:
- Draws: Z-Score threshold lines (±2σ, ±1.5σ) / 绘制:Z-Score阈值线(±2σ、±1.5σ)
- Labels: Corresponding percentiles (≈P98, ≈P93, ≈P7, ≈P2) / 标注:对应百分位(≈P98、≈P93、≈P7、≈P2)
- Advantage: Instantly understand statistical meaning and historical position / 优势:一眼看懂统计意义和历史位置
**Other Modes / 其他模式**:
- `Z-Score`: Statistical threshold lines only / 仅显示统计学阈值线
- `Percentile`: Percentile lines only / 仅显示百分位线
- `Both`: Display both types (denser) / 同时显示两类线(较密集)
### Practical Examples / 实际应用示例
**Scenario 1: Identifying Extreme Opportunities / 场景1:识别极端机会**
```
Current RSI / 当前RSI: 25.3
Dashboard shows / Dashboard显示:
Z-Score: −2.35σ (≈P1)
Percentile: P5 (< −2σ)
Status: 🟢 EXTREME OVERSOLD
Interpretation / 解读:
• Statistical perspective / 统计学视角: Beyond 99% confidence interval (|Z| > 2.3) / 超过99%置信区间,极端异常
• Intuitive perspective / 直观视角: Lower than 99% of historical values / 低于99%的历史值都低,罕见超卖
• Conclusion / 结论: Strong buy signal 🔥 / 强力买入信号 🔥
```
**Scenario 2: Normal Signal Judgment / 场景2:普通信号判断**
```
Current RSI / 当前RSI: 63.8
Dashboard shows / Dashboard显示:
Z-Score: +1.52σ (≈P94)
Percentile: P90 (+1.5σ ~ +2σ)
Status: 🟠 OVERBOUGHT
Interpretation / 解读:
• Statistical perspective / 统计学视角: ~1.5 std dev, notably high but not extreme / 约1.5倍标准差,显著偏高但未极端
• Intuitive perspective / 直观视角: Higher than 90% of historical values / 高于90%的历史值,轻度超买
• Conclusion / 结论: Consider reducing position, not forced sell ⬇️ / 考虑减仓,非强制卖出 ⬇️
```
### Dashboard Display Logic / Dashboard显示逻辑
**Z-Score Row Display / Z-Score行显示**:
- Always shows current Z-value (2 decimal places) / 始终显示当前Z值(精确到2位小数)
- Auto-calculates approximate percentile: `≈P[value]` / 自动计算对应的近似百分位:`≈P[数值]`
- Uses Error Function for precise conversion / 使用误差函数(Error Function)精确转换
**Percentile Row Display / Percentile行显示**:
- Shows RSI's percentile range (P5, P10, P25, etc.) / 显示RSI所处的百分位区间(P5, P10, P25等)
- Labels corresponding Z-value range (e.g., `−1.5σ ~ −2σ`) / 标注对应的Z值范围(如:`−1.5σ ~ −2σ`)
- Helps understand what "P10" means statistically / 帮助理解"P10"的统计意义
**Color Association / 颜色关联**:
- Both rows use same status color (green/yellow/white/orange/red) / 两行使用相同的状态颜色(绿/黄/白/橙/红)
- Visually reinforces "same indicator, different expressions" / 视觉上强化"同一指标的不同表达"概念
---
### Dashboard Setups / 仪表盘配置
#### Full Mode (PC/Tablet)
Shows detailed stats, MTF status, and divergence info.
显示详细统计、MTF状态和背离信息。
#### Mobile Mode (Phone) / 手机模式
Simplified 3-row layout optimized for small screens.
极简3行布局,专为手机屏幕优化。
- Row 1: RSI Value / 第1行:RSI数值
- Row 2: Signal Status (Emoji) / 第2行:信号状态 (Emoji)
- Row 3: Trend/Filter Status / 第3行:趋势/过滤状态
### 📈 Dashboard Example / 面板示例
```
┌─────────────────────────────────┐
│ ADAPTIVE RSI PRO 35.2 │
├─────────────────────────────────┤
│ Status 🟢 EXTREME OVERSOLD │
│ Percentile P10 ↓ DOWN │
│ Lookback[Auto] 456 ✅✅✅ │
├─────────────────────────────────├ (Full Mode Only)
│ ── MTF ── │
│ 1h | 4h | D 🟢 | ⚪ | 🟢 │
│ Resonance 🟢 3/4 OVERSOLD │
├─────────────────────────────────┤
│ Divergence[Normal] 🟢 BULL (5/60) │
├─────────────────────────────────┤
│ ── STATS ── (20 bars) │
│ 🌟 MTF Buy(12) +4.2% | 83% │
│ 🌟 MTF Sell(8) +3.8% | 75% │
│ 💎 Div Buy(15) +3.5% | 80% │
│ 💎 Div Sell(11) +2.9% | 73% │
│ 🔥 Ext Buy(45) +2.1% | 67% │
│ ❄️ Ext Sell(38) +1.8% | 63% │
└─────────────────────────────────┘
```
**Health Indicators / 健康度指标**:
- ✅✅✅ = All healthy (所有健康): Sample coverage ≥ 80%, Distribution spread ≥ 15, Statistical validity ≥ 90%
- ⚠️ present = Warning (警告): One or more health checks failed, consider using Custom mode with larger lookback
---
## Chart Lines Guide / 图表线条指南

### 📊 主要线条 / Main Lines
| 线条 | 颜色/样式 | 含义 | 作用 |
|------|----------|------|------|
| **RSI主线** | 黄色粗线 | 当前RSI值 | 实时跟踪相对强弱指标 |
| **P50 自适应中位数** | 白色阶梯线 | 动态中线 | 根据历史数据自动调整的中位数,比固定50更准确 |
### 🔴 超买阈值线 / Overbought Thresholds (上方红色)
| 线条 | Z-Score | 百分位 | 样式 | 信号 |
|------|---------|--------|------|------|
| **极端超买线** | +2σ | ≈P98 | 实线 | 触发 ❄️ 极端超买信号(强卖出) |
| **普通超买线** | +1.5σ | ≈P93 | 圆点虚线 | 触发 ⬇️ 普通超买信号(考虑卖出) |
### 🟢 超卖阈值线 / Oversold Thresholds (下方绿色)
| 线条 | Z-Score | 百分位 | 样式 | 信号 |
|------|---------|--------|------|------|
| **极端超卖线** | -2σ | ≈P2 | 实线 | 触发 🔥 极端超卖信号(强买入) |
| **普通超卖线** | -1.5σ | ≈P7 | 圆点虚线 | 触发 ⬆️ 普通超卖信号(考虑买入) |
### ⚪ 固定参考线 / Fixed Reference Lines
| 线条 | 位置 | 样式 | 作用 |
|------|------|------|------|
| **0线** | 底部 | 灰色点线 | RSI下边界 |
| **50线** | 中间 | 灰色点线 | 传统固定中线参考 |
| **100线** | 顶部 | 灰色点线 | RSI上边界 |
### 🎨 渐变填充区域 / Gradient Fill Zones
- **红色渐变**(上方):超买区域,颜色越深表示越极端
- P95-P90(深红)> P90-P75(中红)> P75-P50(浅红)
- **绿色渐变**(下方):超卖区域,颜色越深表示越极端
- P10-P5(深绿)> P25-P10(中绿)> P50-P25(浅绿)
### 💡 关键要点 / Key Points
**线条样式区分 / Line Style Distinction:**
- **实线** = 极端信号(±2σ),优先级高,统计上95%置信区间外
- **圆点虚线** = 普通信号(±1.5σ),优先级较低,显著偏离但未极端
**动态 vs 固定 / Dynamic vs Fixed:**
- **彩色线**(红/绿)= 根据历史波动动态调整,适应不同资产特性
- **灰色虚线** = 固定不变的参考线,用于传统RSI对比
**视觉层次 / Visual Hierarchy:**
- 线条粗细:RSI主线(最粗)> 极端阈值(粗)> 普通阈值(细)> 参考线(最细)
- 透明度:核心线条(不透明)> 百分位线(半透明)> 填充区(高透明)
---
## Settings / 设置
### RSI Settings / RSI设置
| Setting | Default | Description |
|---------|---------|-------------|
| RSI Length | 14 | RSI calculation period / RSI计算周期 |
| RSI Source | Close | Price source / 价格源 |
### Adaptive Settings / 自适应设置
| Setting | Default | Description |
|---------|---------|-------------|
| Lookback Mode | Auto | Auto (statistical formula) / Custom / 自动/自定义 |
| Custom Lookback | 252 | Only used in Custom mode / 仅自定义模式使用 |
| Precision | Normal | High/Normal/Low: Adjusts error tolerance / 精度等级 |
| History Depth | 1 Year | 6 Months / 1 Year / 2 Years for volatility calculation / 波动率历史深度 |
### Visual Settings / 视觉设置
| Setting | Default | Description |
|---------|---------|-------------|
| Threshold Line Mode | **Unified** | Unified(推荐)/Z-Score/Percentile/Both / 阈值线模式 |
| Show Gradient Fill | ON | Display background gradients / 显示背景渐变 |
| Show Dashboard | ON | Display dashboard panel / 显示仪表盘面板 |
| Dashboard Mode | Full | Full/Lite/Mobile(Phone) / 面板模式 |
| Dashboard Size | Normal | Tiny/Small/Normal/Large / 面板大小 |
| Dashboard Transparency | 30 | 0-100% transparency level / 透明度 |
| Bullish Color | #00E676 | Custom color for bullish signals / 牛市信号颜色 |
| Bearish Color | #FF5252 | Custom color for bearish signals / 熊市信号颜色 |
| RSI Line Color | #FFEB3B | RSI line color / RSI主线颜色 |
### Trend Filter / 趋势过滤
| Setting | Default | Description |
|---------|---------|-------------|
| Enable Trend Filter | OFF | Only trigger signals in trend direction / 趋势方向过滤 |
| Filter Mode | Auto | Auto/Fixed 50/Adaptive P50/SMA(RSI)/BB(RSI) / 过滤模式 |
### Alert Settings / 警报设置
| Setting | Default | Description |
|---------|---------|-------------|
| **🎯 Smart Alert** | **ON** | **V6 Unified Alert System** / V6统一警报系统 |
| Show Normal Signals | OFF | Display ⬆️⬇️ on chart / 图表显示普通信号 |
| Normal Signal Threshold | 1.5σ | Z-Score threshold (1.0-2.0σ) / 普通信号阈值 |
| Enable Signal Cooldown | ON | Prevent duplicate signal counting / 防止重复信号 |
| Cooldown Period | 5 bars | Bars between same signal type / 冷却K线数 |
### Multi-Timeframe / 多时间框架
| Setting | Default | Description |
|---------|---------|-------------|
| Enable | ON | Show MTF analysis / 显示MTF分析 |
| MTF Mode | **Auto** | **Auto** (Fractal Breakdown) / **Manual** (Fixed) / 自动/手动模式 |
| TF1/TF2/TF3 | 60/240/D | Timeframes (Manual mode only) / 时间框架(仅手动模式)|
### Signal Statistics / 信号统计
| Setting | Default | Description |
|---------|---------|-------------|
| Enable | ON | Track performance / 跟踪表现 |
| Forward Bars | 20 | Bars for return calculation / 收益计算K线数 |
### Divergence Detection / 背离检测
| Setting | Default | Description |
|---------|---------|-------------|
| Enable Detection | ON | Detect divergences / 检测背离 |
| Divergence Mode | Auto | Auto/Low Vol/Normal/High Vol/Crypto/Custom / 背离模式 |
| Custom Lookback | 5 | Only in Custom mode / 仅自定义模式使用 |
| Custom Range | 60 | Only in Custom mode / 仅自定义模式使用 |
**Auto Mode Presets / 自动模式预设**:
- Low Vol (蓝筹/ETF): Lookback 3, Range 40
- Normal (一般股票): Lookback 5, Range 60
- High Vol (成长股): Lookback 7, Range 80
- Crypto (加密货币): Lookback 10, Range 120
---
## Alerts / 警报
### 🎯 Smart Alert (V6 Unified System)
**The only alert method / 唯一的警报方式** - 自动聚合所有信号到一条富文本消息
Automatically aggregates all signals into a single rich-text message.
**Setup Steps / 设置方法**:
1. Keep "🎯 Smart Alert" enabled in indicator settings (default) / 指标设置中保持 "🎯 Smart Alert" 开启(默认)
2. When creating alert, select **"Any alert() function call"** / 创建警报时选择 **"Any alert() function call"**
3. Done! You'll receive real-time aggregated alerts / 完成!您会收到实时的聚合警报
**Message Example / 消息示例**:
```
AAPL: 🟢 BUY SIGNALS → 🌟MTF共振 💎背离 🔥极端 | RSI:25.3 Z:-2.1σ (≈P2)
AAPL: 🔴 SELL SIGNALS → ❄️极端 | RSI:78.5 Z:2.3σ (≈P98)
```
**Features / 特性**:
- ✅ **Real-time trigger / 实时触发** - Sends when condition met within bar / K线运行中触发条件即发送
- ✅ **Anti-flicker / 防闪烁** - Uses `varip` to prevent duplicate alerts from signal flickering within same bar / 使用 `varip` 防止信号闪烁导致同一K线内重复警报
- ✅ **Signal upgrade detection / 信号升级检测** - Alerts when stronger signal appears (e.g., 🔥Extreme → 🌟MTF) even on same bar / 同一K线内出现更强信号时也会触发(如:🔥极端 → 🌟MTF共振)
- ✅ **Full context / 完整上下文** - Includes RSI value, Z-Score, approximate percentile / 包含RSI值、Z-Score、近似百分位
- ✅ **Auto-aggregation / 自动聚合** - One message contains all triggered signals / 一条消息包含所有触发的信号
- ✅ **Buy/Sell independent tracking / 买卖独立追踪** - Buy and Sell alerts tracked separately / 买入和卖出警报独立追踪,互不干扰
**Signal Priority Levels / 信号优先级**:
| Level 等级 | Signal 信号 | Description 描述 |
|------------|-------------|------------------|
| 4 (Highest) | 🌟 MTF Resonance | Multi-timeframe agreement / 多周期共振 |
| 3 | 💎 Divergence | Divergence + Extreme zone / 背离+极端区 |
| 2 | 🔥❄️ Extreme | Extreme oversold/overbought / 极端超卖/超买 |
| 1 (Lowest) | ⬆️⬇️ Normal | Normal oversold/overbought / 普通超卖/超买 |
---
## Usage Tips / 使用建议
| Timeframe | Lookback | Use Case |
|-----------|----------|----------|
| Daily | 252 | Swing trading / 波段交易 |
| 4H | 1000 | Short-term / 短线 |
| 1H | 2000 | Day trading / 日内交易 |
**Best Practices / 最佳实践:**
1. Focus on 🌟 and 💎 signals (highest priority) / 优先关注 🌟 和 💎 信号(最高优先级)
2. Use MTF resonance for high-confidence entries / 使用 MTF 共振确认高置信度入场
3. Check win rate in stats before trading / 交易前查看统计胜率
---
## Changelog / 更新日志
### v6.2 - Smart Alert Anti-Flicker / 智能防抖警报 (Current / 当前版本)
- 🛡️ **Anti-flicker Mechanism / 防闪烁机制**: Fixed issue where signal flickering caused multiple duplicate alerts within same bar. Now uses `varip` to track alert status per bar. / 修复信号闪烁导致同一K线内发送多次重复警报的问题,使用 `varip` 追踪每根K线的警报状态。
- 📈 **Signal Upgrade Detection / 信号升级检测**: Tracks signal priority level (MTF=4, Divergence=3, Extreme=2, Normal=1). Sends new alert when stronger signal appears on same bar. / 追踪信号优先级等级。同一K线内出现更强信号时会发送新警报。
- 🔄 **Independent Buy/Sell Tracking / 买卖独立追踪**: Buy and Sell alerts are tracked independently, allowing direction changes within same bar. / 买入和卖出警报独立追踪,允许同一K线内捕捉方向变化。
### v6.1 - Mobile Experience / 移动端体验
- 📱 **Mobile Dashboard / 手机端面板**: Added simplified "Mobile" mode optimized for phone screens (RSI + Signal Emoji only). / 新增简化的"Mobile"模式,针对手机屏幕优化(仅显示RSI+信号Emoji)。
- 🔥 **Persistent Zone Status / 持续区域状态**: Mobile Dashboard now shows persistent extreme zone indicators when no new signal but RSI remains in zone: `🔥持续` (Extreme Oversold), `❄️持续` (Extreme Overbought), `⬆️区` (Oversold), `⬇️区` (Overbought). / 手机端面板现在显示持续极端区域指示器:无新信号但RSI仍在区域内时显示持续状态。
- 🔧 **UX Improvements / 用户体验优化**: Optimized font sizes and layout for small screens. / 优化字体大小和小屏幕布局。
### v6.0 - Alert System Simplification & V6 Optimization / 警报系统简化与V6优化
- 🎯 **Smart Alert System / 智能警报系统简化**:
- **Unified entry / 唯一警报入口**: Removed all legacy alertcondition, unified to V6 Smart Alert / 移除所有legacy alertcondition,统一为V6 Smart Alert
- **Real-time trigger / 实时触发**: Changed to `alert.freq_once_per_bar` for intra-bar response / 改为 `alert.freq_once_per_bar` 实现K线内实时响应
- **Smart dedup / 智能去重**: Rising edge detection (`signal and not signal[1]`) / 上升沿检测,只在新信号出现时触发
- **Auto-aggregation / 自动聚合**: Single message with all signals + RSI + Z-Score + Percentile / 单条消息包含所有触发信号 + RSI + Z-Score + 百分位
- **Simplified settings / 简化设置**: Removed "Extreme Alerts" and "Normal Alerts", only Smart Alert toggle / 移除 "Extreme Alerts" 和 "Normal Alerts",只保留Smart Alert开关
- 🛠 **Performance Optimization / 性能优化**:
- Reduced `request.security` calls by 50% using Tuple Requests / 使用元组请求减少50%的`request.security`调用
- Implemented `str.format()` for cleaner and faster string processing / 实现`str.format()`使字符串处理更简洁高效
- 🧹 **Code Cleanup / 代码清理**:
- Refactored timeframe display and alert logic / 重构时间框架显示和警报逻辑
- Fixed plot limit issues and tuple assignment syntax / 修复绑点限制问题和元组赋值语法
- Unified plot titles with percentile annotations / 统一绑点标题与百分位标注
### v5.0 - Adaptive Fractal MTF / 自适应分形MTF
- 🧠 **Adaptive Fractal MTF / 自适应分形MTF**: New "Auto" mode automatically selects lower timeframes for precision structure analysis (Internal Fractal Resonance). / 新增"Auto"模式,自动选择更低时间框架进行精确结构分析(内部分形共振)。
- Daily Chart → Analyzes 1H & 4H / 日线图 → 分析1小时和4小时
- 1H Chart → Analyzes 5m & 15m / 1小时图 → 分析5分钟和15分钟
- 15m Chart → Analyzes 1m & 5m / 15分钟图 → 分析1分钟和5分钟
- 🛠 **Code Refactoring / 代码重构**: Implemented Pine Script v6 UDTs (Objects) and Methods for robust signal statistics. / 实现Pine Script v6 UDT(对象)和方法,增强信号统计的健壮性。
- 🎨 **Dashboard Optimization / 面板优化**: Enhanced string formatting using `str.format` for cleaner display. / 使用`str.format`优化字符串格式,显示更简洁。
### v4.0 - Pine Script v6 Upgrade / Pine Script v6升级
- 🚀 Upgraded entire codebase to **Pine Script v6** engine / 将整个代码库升级到 **Pine Script v6** 引擎
- ⚡ Optimization for better performance and future-proofing / 性能优化,面向未来
- 🛠 Maintenance updates for latest TradingView standards / 维护更新以符合最新TradingView标准
### v3.0 - Auto-Adaptive Systems / 自动自适应系统
- ✨ Auto-adaptive lookback using formula `n = (Z × σ / E)²` / 使用统计公式 `n = (Z × σ / E)²` 自动计算回看期
- ✨ Auto-adaptive trend filter with 5 modes / 5种模式的自动自适应趋势过滤器
- ✨ Auto-adaptive divergence detection with 4 presets / 4种预设的自动自适应背离检测
- ✨ Layered statistics (MTF/Divergence/Extreme/Normal) / 分层统计系统(MTF/背离/极端/普通)
- ✨ Signal cooldown to prevent duplicate counting / 信号冷却机制防止重复计数
- ✨ Health indicators for lookback validation / 回看期健康度指标验证
- ✨ Dashboard modes (Lite/Full) with customization / 面板模式(Lite/Full)支持自定义大小和透明度
- ✨ Dual volatility system (short + long-term) / 双重波动率系统(短期+长期)
### v2.1 - Signal Optimization / 信号优化
- ✨ Consolidated signals with priority system / 信号合并与优先级系统(无重叠)
- ✨ Emoji-based signal display / 基于Emoji的信号显示
- ✨ MTF timeframe auto-skip for duplicates / MTF时间框架自动跳过重复
### v2.0 - Pro Edition / 专业版
- ✨ Added Trend Filter, MTF RSI, Statistics, Divergence / 新增趋势过滤、MTF RSI、统计、背离检测
- ✨ Z-Score based signal triggering / 基于Z-Score的信号触发
### v1.0 - Initial Release / 初始发布
- ✨ Adaptive percentile-based thresholds / 自适应百分位阈值
---
## License
MIT License - Feel free to use, modify, and share.
סקריפט קוד פתוח
ברוח האמיתית של TradingView, יוצר הסקריפט הזה הפך אותו לקוד פתוח, כך שסוחרים יוכלו לעיין בו ולאמת את פעולתו. כל הכבוד למחבר! אמנם ניתן להשתמש בו בחינם, אך זכור כי פרסום חוזר של הקוד כפוף ל־כללי הבית שלנו.
כתב ויתור
המידע והפרסומים אינם מיועדים להיות, ואינם מהווים, ייעוץ או המלצה פיננסית, השקעתית, מסחרית או מכל סוג אחר המסופקת או מאושרת על ידי TradingView. קרא עוד ב־תנאי השימוש.