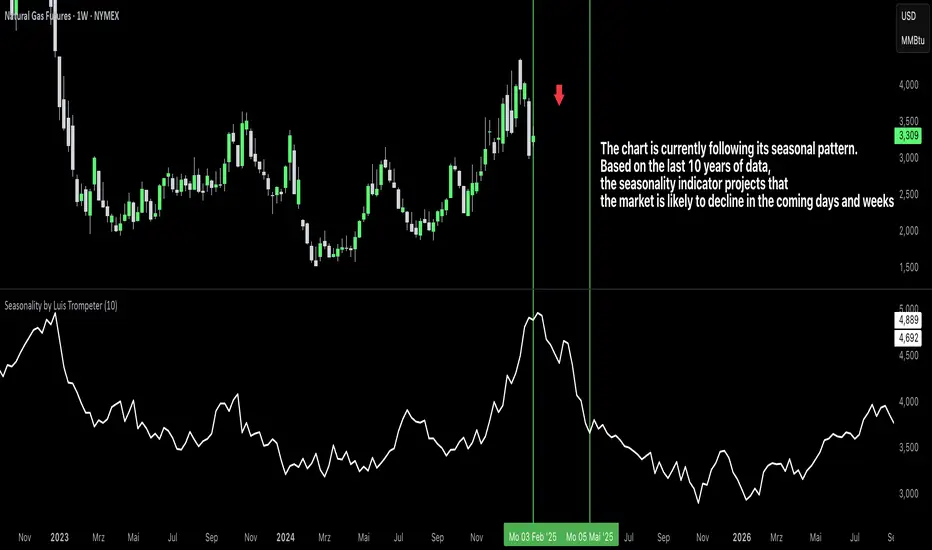
Seasonality by Luis Trompeter
The number of years included in the calculation can be adjusted directly in the settings panel.
Based on this historical window, the indicator creates an average seasonal curve, which represents how the market typically behaved during each part of the year.
This averaged curve acts as a forecast for the upcoming months, highlighting periods where the market has shown a consistent tendency in the past.
Traders can use this seasonal projection to identify times of higher statistical likelihood for upward or downward movement.
The indicator works especially well when combined with the Seasonality Analysis Tool, which helps identify specific historical windows and strengthens overall seasonal decision-making.
Timeframe Requirement
This indicator must be used exclusively on the daily timeframe, as all calculations are based on daily candle data.
Other timeframes will not display accurate seasonal structures.
The Seasonality Indicator provides a clear, data-driven view of recurring annual patterns and allows traders to better understand when historical tendencies may influence future price action.
סקריפט להזמנה בלבד
רק משתמשים שאושרו על ידי המחבר יכולים לגשת לסקריפט הזה. יהיה עליך לשלוח בקשת גישה ולקבל אישור לשימוש. בדרך כלל, הגישה ניתנת לאחר תשלום. למידע נוסף, עקוב אחר ההוראות של היוצר בהמשך או צור קשר עם luistrompeter ישירות.
TradingView לא ממליצה לשלם עבור סקריפט או להשתמש בו אלא אם כן אתה סומך לחלוטין על המחבר שלו ומבין כיצד הוא פועל. ייתכן שתוכל גם למצוא חלופות חינמיות וקוד פתוח ב-סקריפטים הקהילתיים שלנו.
הוראות המחבר
כתב ויתור
סקריפט להזמנה בלבד
רק משתמשים שאושרו על ידי המחבר יכולים לגשת לסקריפט הזה. יהיה עליך לשלוח בקשת גישה ולקבל אישור לשימוש. בדרך כלל, הגישה ניתנת לאחר תשלום. למידע נוסף, עקוב אחר ההוראות של היוצר בהמשך או צור קשר עם luistrompeter ישירות.
TradingView לא ממליצה לשלם עבור סקריפט או להשתמש בו אלא אם כן אתה סומך לחלוטין על המחבר שלו ומבין כיצד הוא פועל. ייתכן שתוכל גם למצוא חלופות חינמיות וקוד פתוח ב-סקריפטים הקהילתיים שלנו.