cBoer

Murrey's Math Oscillator_V2 - Notifications
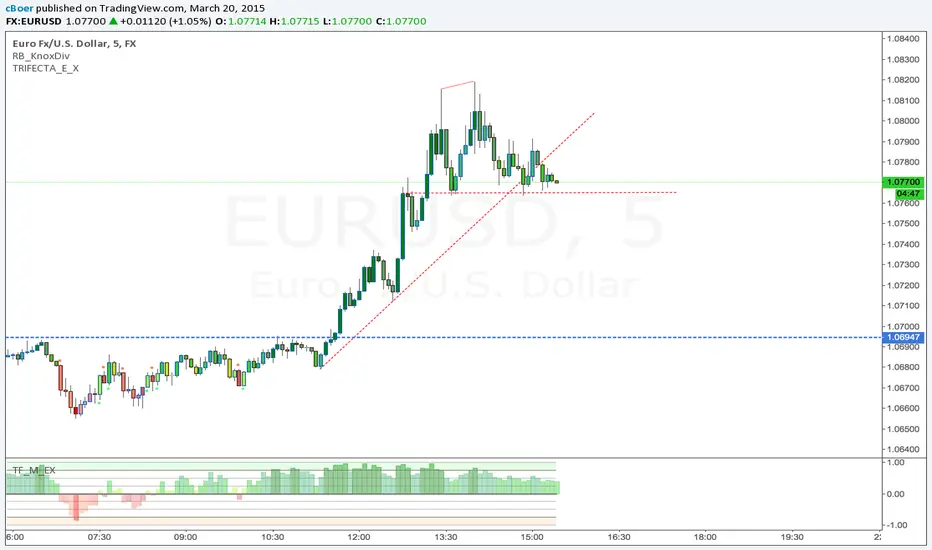
TF Murrey's Math Oscillator_V2 - Notifications. For those of you who like the Histogram :)
סקריפט קוד פתוח

ברוח TradingView אמיתית, מחבר הסקריפט הזה פרסם אותו בקוד פתוח, כך שסוחרים יכולים להבין ולאמת אותו. כל הכבוד למחבר! אתה יכול להשתמש בו בחינם, אך שימוש חוזר בקוד זה בפרסום כפוף לכללי הבית. אתה יכול להכניס אותו למועדפים כדי להשתמש בו בגרף.

כתב ויתור

המידע והפרסומים אינם אמורים להיות, ואינם מהווים, עצות פיננסיות, השקעות, מסחר או סוגים אחרים של עצות או המלצות שסופקו או מאושרים על ידי TradingView. קרא עוד בתנאים וההגבלות.

רוצה להשתמש בסקריפ זה בגרף?
// Created & Developed by Ucsgears, based on Murrey Math Line Principle - Modified by CCB 20.03.2015
// Version 2 - March, 12 - 2015

study(title="TF Murrey Entry and Exit", shorttitle="TF_M_EX", overlay=false, precision = 2)

// Inputs
length = input(100, minval = 10, title = "Look back Length")
mult = input(0.125, title = "Mutiplier; Only Supports 0.125 = 1/8")
lines = input(true, title= "Show Murrey Math Fractals")
bc = input(true, title = "Show Bar Colors Based On Oscillator")

// Donchanin Channel
hi = highest(high, length)
lo = lowest(low, length)
range = hi - lo
multiplier = (range) * mult
midline = lo + multiplier * 4

oscillator = (close - midline)/(range/2)

a = oscillator > 0 and oscillator < mult*2
b = oscillator > 0 and oscillator < mult*4
c = oscillator > 0 and oscillator < mult*6
d = oscillator > 0 and oscillator < mult*8

z = oscillator < 0 and oscillator > -mult*2
y = oscillator < 0 and oscillator > -mult*4
x = oscillator < 0 and oscillator > -mult*6
w = oscillator < 0 and oscillator > -mult*8

colordef = a ? #ADFF2F : b ? #32CD32 : c ? #3CB371 : d ? #008000 : z ? #CD5C5C : y ? #FA8072 : x ? #FFA07A : w ? #FF0000 : blue

barChangedBear = ((oscillator[1] > 0 and oscillator[1] < mult*8) and (oscillator < 0 and oscillator > -mult*8)) ? true : false
barChangedBull = ((oscillator[1] < 0 and oscillator[1] > -mult*8) and (oscillator > 0 and oscillator < mult*8)) ? true : false

plotshape(barChangedBear ? oscillator : na, title="Turned Bear", style=shape.circle, color=red, transp=100)
plotshape(barChangedBull ? oscillator : na, title="Turned Bull", style=shape.circle, color=lime, transp=100)

plot (oscillator, color = colordef, title = "Murrey Math Oscillator", style = columns, transp = 60)
plot(0, title = "Zero Line", color = gray, linewidth = 4)

plot(lines == 1 ? mult*2 : na, title = "First Positive Quadrant", color = gray, linewidth = 1)
plot(lines == 1 ? mult*4 : na, title = "Second Positive Quadrant", color = gray, linewidth = 1)
p3 = plot(lines == 1 ? mult*6 : na, title = "Third Positive Quadrant", color = gray, linewidth = 2)
p4 = plot(lines == 1 ? mult*8 : na, title = "Fourth Positive Quadrant", color = gray, linewidth = 1)
plot(lines == 1 ? -mult*2 : na, title = "First Negative Quadrant", color = gray, linewidth = 1)
plot(lines == 1 ? -mult*4 : na, title = "Second Negative Quadrant", color = gray, linewidth = 1)
p2 = plot(lines == 1 ? -mult*6 : na, title = "Third Negative Quadrant", color = gray, linewidth = 2)
p1 = plot(lines == 1 ? -mult*8 : na, title = "Fourth Negative Quadrant", color = gray, linewidth = 1)

fill (p1,p2, color = orange)
fill (p3,p4, color = lime)

// Bar Color Oversold and Overbought
bcolor = bc == 1 ? colordef : na
barcolor(bcolor)