PROTECTED SOURCE SCRIPT
AHS_MicroGaps_ReversalAttempts V1.0
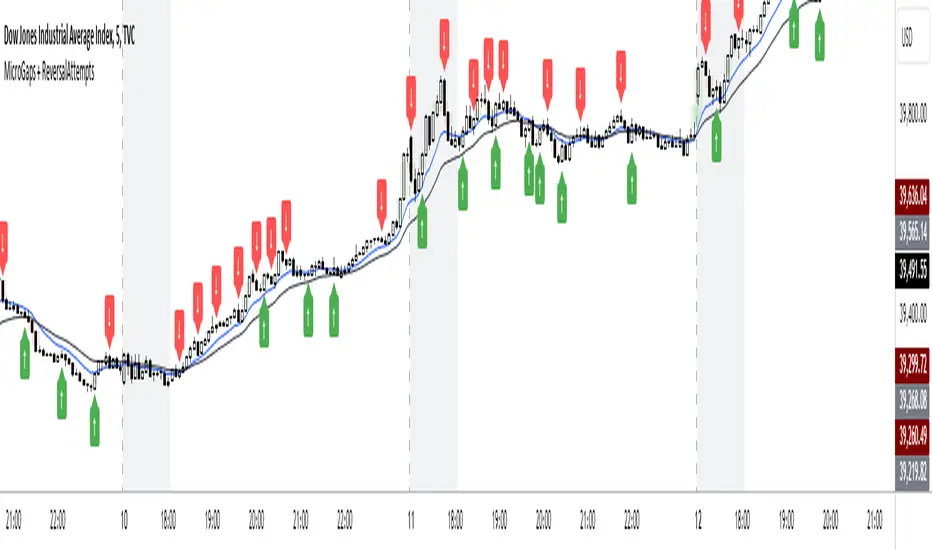
MicroGaps + ReversalAttempts Indicator
Summary:
The "MicroGaps + ReversalAttempts" is a custom TradingView indicator that identifies and visualizes micro gaps, detects reversal attempts after gaps, and optionally plots moving averages and the first-hour trading range. The indicator plots micro gaps as boxes on the chart and marks potential reversal attempts with arrows.
Features:
1. Micro Gaps**:
- Show Micro Gaps: Toggle to display micro gaps on the chart.
- Max Number of Gaps: Limit the number of gaps displayed.
- Minimal Deviation: Set the minimum size for detected gaps as a percentage of the average high-low range for the last 14 bars.
- Limit Max Gap Trail Length: Limit the maximum length (in bars) that a gap is tracked.
2. Gap Colors:
- Up Gaps: Set the border and background colors for upward gaps.
- Down Gaps: Set the border and background colors for downward gaps.
3. Reversal Attempts:
- 1st Reversal Attempt Bulls: Color for the first bullish reversal attempt after a micro gap.
- 1st Reversal Attempt Bears: Color for the first bearish reversal attempt after a micro gap.
4. Moving Averages:
- EMA 1 and EMA 2: Set lengths, colors, and toggle visibility for two EMAs.
- Show EMA Cross: Option to display markers where the EMAs cross each other.
5. First Hour Box:
- Show First Hour Box: Toggle to display the first hour's high and low range as a shaded area.
- Activate First Hour High/Low View: Toggle to highlight the first hour high/low range.
Usage:
1. Adding the Indicator:
- Add the "MicroGaps + ReversalAttempts" indicator to your TradingView chart.
2. Configuring Inputs:
- Micro Gaps: Enable the "Show Micro Gaps" option to visualize gaps.
- Set Parameters: Adjust the parameters for the maximum number of gaps, minimal deviation, and gap trail length.
- Gap Colors: Customize the colors for upward and downward gaps.
- Reversal Attempts: Set colors for the first bullish and bearish reversal attempts.
3. Using the Visuals:
- Micro Gaps: Gaps are displayed as colored boxes on the chart.
- Reversal Attempts: Arrows are plotted above/below the bars to indicate potential reversal attempts after gaps.
- Moving Averages: Configure the lengths and colors of two EMAs and optionally display markers at their crossover points.
- First Hour Box: Enable and customize the first hour high/low range visualization.
4. Alerts:
- Alerts are triggered for the appearance and closure of gaps. Configure these alerts as needed for your trading strategy.
5. First Hour Range:
- The first hour's trading range can be highlighted, providing visual cues about potential support and resistance levels during the session.
This indicator helps traders identify significant market events like micro gaps and reversal attempts, supplemented with moving averages and first-hour range visualization for a comprehensive analysis tool.
סקריפט מוגן
סקריפט זה פורסם כמקור סגור. עם זאת, תוכל להשתמש בו בחופשיות וללא כל מגבלות – למד עוד כאן
כתב ויתור
המידע והפרסומים אינם מיועדים להיות, ואינם מהווים, ייעוץ או המלצה פיננסית, השקעתית, מסחרית או מכל סוג אחר המסופקת או מאושרת על ידי TradingView. קרא עוד ב־תנאי השימוש.
סקריפט מוגן
סקריפט זה פורסם כמקור סגור. עם זאת, תוכל להשתמש בו בחופשיות וללא כל מגבלות – למד עוד כאן
כתב ויתור
המידע והפרסומים אינם מיועדים להיות, ואינם מהווים, ייעוץ או המלצה פיננסית, השקעתית, מסחרית או מכל סוג אחר המסופקת או מאושרת על ידי TradingView. קרא עוד ב־תנאי השימוש.