RSI5 Multi Time Frame Indicator
Date of Creation: 12/13/2016
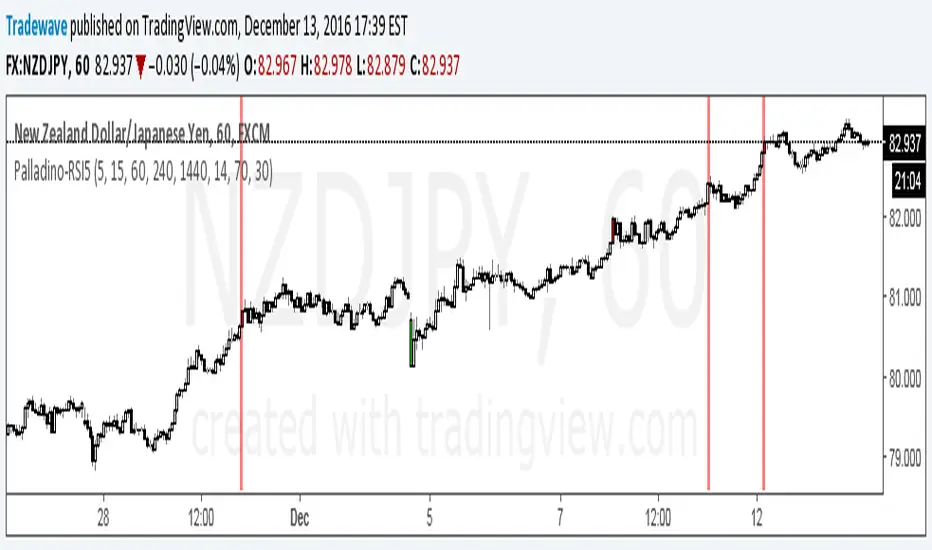
Checks overbought or oversold conditions across 5 time frames.
If Time frame 1, 2 and 3 are all overbought then bar color changes to red
If Time frame 1, 2 and 3 are all oversold then bar color changes to green
If Time frame 1, 2, 3, 4 and 5 are all overbought then a vertical red line is added to the plot
If Time frame 1, 2, 3, 4 and 5 are all oversold then a vertical green line is added to the plot
The user has the ability to change:
1) Any of the 5 time frames (Set in minutes: m5 = 5, m15 = 15, h1 = 60, h4 = 240, D = 1440...)
2) RSI overbought threshold Level
3) RSI oversold threshold Level
4) RSI Period
סקריפט להזמנה בלבד
רק משתמשים שאושרו על ידי המחבר יכולים לגשת לסקריפט הזה. יהיה עליך לשלוח בקשת גישה ולקבל אישור לשימוש. בדרך כלל, הגישה ניתנת לאחר תשלום. למידע נוסף, עקוב אחר ההוראות של היוצר בהמשך או צור קשר עם LiquidityTracker ישירות.
TradingView לא ממליצה לשלם עבור סקריפט או להשתמש בו אלא אם כן אתה סומך לחלוטין על המחבר שלו ומבין כיצד הוא פועל. ייתכן שתוכל גם למצוא חלופות חינמיות וקוד פתוח ב-סקריפטים הקהילתיים שלנו.
הוראות המחבר
כתב ויתור
סקריפט להזמנה בלבד
רק משתמשים שאושרו על ידי המחבר יכולים לגשת לסקריפט הזה. יהיה עליך לשלוח בקשת גישה ולקבל אישור לשימוש. בדרך כלל, הגישה ניתנת לאחר תשלום. למידע נוסף, עקוב אחר ההוראות של היוצר בהמשך או צור קשר עם LiquidityTracker ישירות.
TradingView לא ממליצה לשלם עבור סקריפט או להשתמש בו אלא אם כן אתה סומך לחלוטין על המחבר שלו ומבין כיצד הוא פועל. ייתכן שתוכל גם למצוא חלופות חינמיות וקוד פתוח ב-סקריפטים הקהילתיים שלנו.