OPEN-SOURCE SCRIPT
CISD Trend Candle + MACD Signal
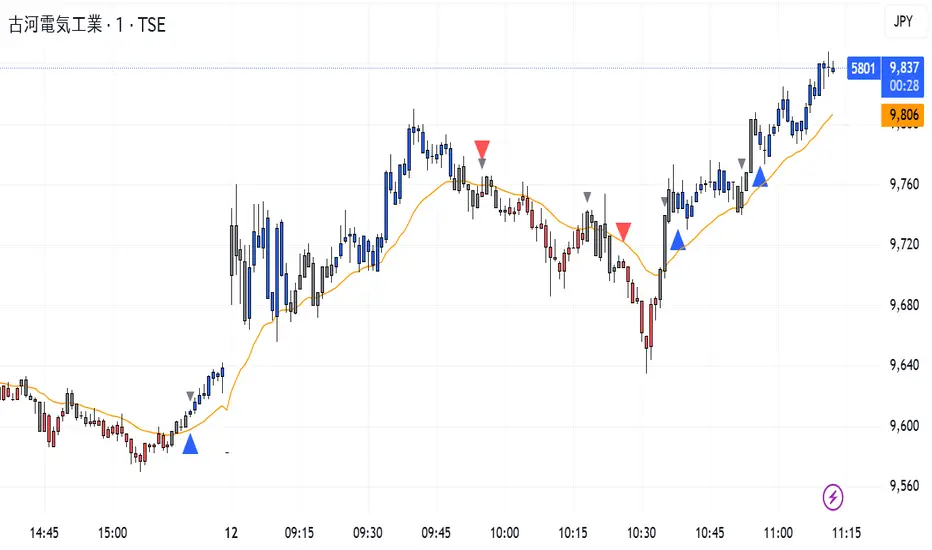
This custom TradingView indicator combines trend-based candle coloring with MACD reversal detection to generate clear entry and exit signals:
🔷 Blue triangle (Buy): Appears when the candles confirm an uptrend (e.g., 5 consecutive closes above 21 EMA) and no long position is currently held.
🔴 Red triangle (Sell): Appears when the candles confirm a downtrend (e.g., 5 consecutive closes below 21 EMA) and no short position is currently held.
⚪ Gray triangle (Exit):
If in a long position, it shows when the candle turns neutral (gray) and the MACD crosses down (bearish signal), or the trend turns red.
If in a short position, it shows when the candle turns neutral and the MACD crosses up (bullish signal), or the trend turns blue.
🟠 Orange line: 21-period EMA used for trend validation.
This logic prevents premature entries and provides structured exit points, aiming to avoid false signals in choppy markets.
סקריפט קוד פתוח
ברוח האמיתית של TradingView, יוצר הסקריפט הזה הפך אותו לקוד פתוח, כך שסוחרים יוכלו לעיין בו ולאמת את פעולתו. כל הכבוד למחבר! אמנם ניתן להשתמש בו בחינם, אך זכור כי פרסום חוזר של הקוד כפוף ל־כללי הבית שלנו.
כתב ויתור
המידע והפרסומים אינם מיועדים להיות, ואינם מהווים, ייעוץ או המלצה פיננסית, השקעתית, מסחרית או מכל סוג אחר המסופקת או מאושרת על ידי TradingView. קרא עוד ב־תנאי השימוש.