PROTECTED SOURCE SCRIPT
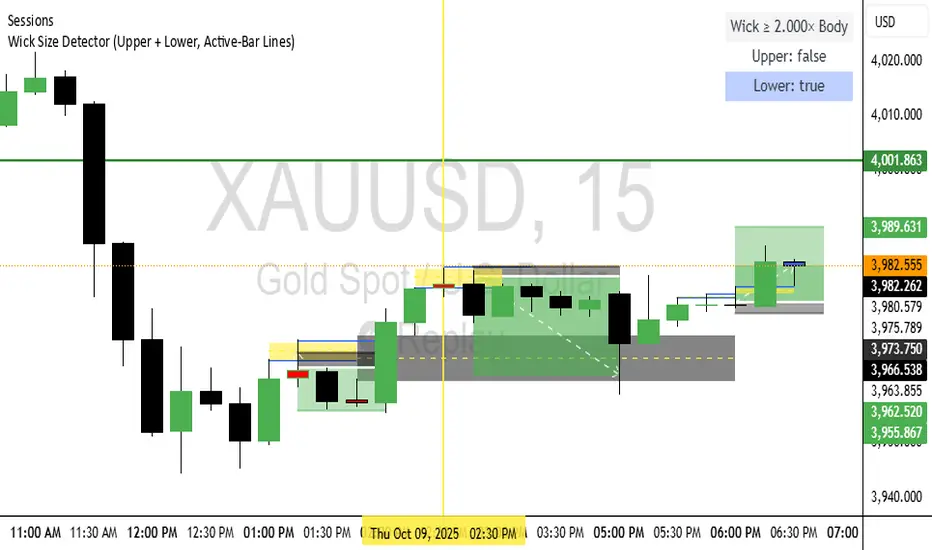
Wick Size Detector (Upper + Lower, Active-Bar Lines)
🧭 1. Understanding What the Indicator Tells You
Each signal means a potential shift in intent — a wick implies rejection of price at one extreme.
Upper Wick (red) → Sellers rejected higher prices → potential short setup.
Lower Wick (green) → Buyers rejected lower prices → potential long setup.
Dual Wick (both large) → Exhaustion / indecision → likely reversal or range start.
The wick is not a trade by itself — it’s a context clue telling you where liquidity was swept and which side failed.
🧩 2. Framework for Trading Wick Signals
Use a two-stage decision model: context → confirmation.
Stage 1: Context Filter
Before taking any wick, make sure the background aligns:
Higher timeframe (1H / 4H / Daily) bias using:
Market structure (higher highs/lows)
EMA slope or Fair Value Gap alignment
Key liquidity (PDH, PDL, Daily Open)
Example:
4H is bullish (higher lows + above 50 EMA) → focus only on green lower-wick signals.
4H is bearish → focus only on red upper-wick signals.
This avoids trading against momentum.
Stage 2: Confirmation & Entry
Once a valid wick signal appears in context:
✅ Entry Logic
Wait for candle with qualifying wick (per indicator).
On next candle:
For a lower wick (buy setup) →
Enter long near the midpoint or discount (50–62%) of the wick candle’s range.
For an upper wick (sell setup) →
Enter short near the midpoint or premium (50–62%) of the wick candle’s range.
🛑 Stop Loss
Below the wick low for buys.
Above the wick high for sells.
🎯 Take Profit
Target prior liquidity points:
For buys → previous highs or equilibrium.
For sells → previous lows or daily open.
Or use a fixed R:R (e.g., 2:1).
⚖️ Optional: Wait for Confirmation (Displacement / MSS)
If you combine this with your ICT-style workflow:
Wait for a market structure shift in direction of the wick.
Confirm the Change in State of Delivery (CISD) before entry.
🧠 3. Example Walkthrough
Setup:
You’re on the 15-minute chart, wickMultiplier = 1.2.
Price makes a big upper wick → indicator flashes red.
On 1H and 4H, you see price near a premium area or PDH.
Next candle opens → you short at the midpoint of that wick candle.
Stop above the wick high.
Take profit near the prior swing low or 2× risk distance.
If you see MSS confirmation → add confluence.
💡 4. Tips for Real Implementation
Multi-timeframe filter: Only take wick signals in alignment with HTF bias.
Session discipline: Limit signals to high-volume sessions (London / New York).
Avoid strong trend continuation candles (small wicks, big bodies).
Combine with displacement → your best trades come when a large wick forms into liquidity, then displacement confirms it.
Avoid every signal: Some wicks are just noise. Wait for those near obvious liquidity (previous highs/lows).
סקריפט מוגן
סקריפט זה פורסם כמקור סגור. עם זאת, אתה יכול להשתמש בו באופן חופשי וללא כל הגבלה - למד עוד כאן.
כתב ויתור
המידע והפרסומים אינם אמורים להיות, ואינם מהווים, עצות פיננסיות, השקעות, מסחר או סוגים אחרים של עצות או המלצות שסופקו או מאושרים על ידי TradingView. קרא עוד בתנאים וההגבלות.
סקריפט מוגן
סקריפט זה פורסם כמקור סגור. עם זאת, אתה יכול להשתמש בו באופן חופשי וללא כל הגבלה - למד עוד כאן.
כתב ויתור
המידע והפרסומים אינם אמורים להיות, ואינם מהווים, עצות פיננסיות, השקעות, מסחר או סוגים אחרים של עצות או המלצות שסופקו או מאושרים על ידי TradingView. קרא עוד בתנאים וההגבלות.