INVITE-ONLY SCRIPT
Skynet PA osc

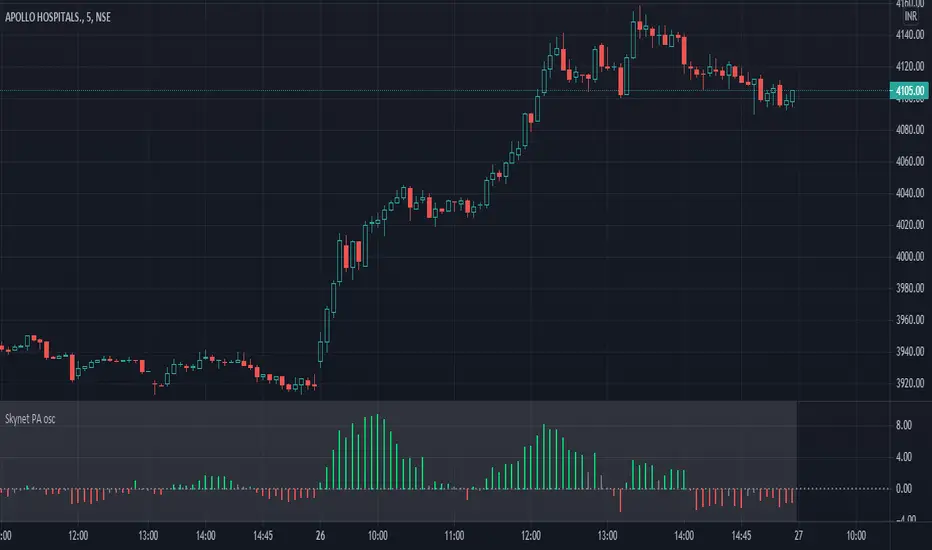
The Skynet PA osc has the following features :
1>>> Oscillator : The oscillator represents the rate of change of close price for the past 20 candles.
1.a> Bullish signal : When the oscillator turns green/lime color, it indicates that the price is gaining momentum on the upside.
1.b> Bearish signal : When the oscillator turns red, it indicates that the price is gaining momentum on the downside.
2>>> Entry/exit points :
2.a>Strong bullish: When an aqua/blue color diamond appears, it indicates a strong bullish momentum for the price.
2.b>Strong bearish : When a pink/purple color diamond appears on the zero line, it indicates a strong bearish momentum for the price.
**** Volume along with the oscillator is used to generate the diamond labels.
Disclaimer: This indicator is not 100% accurate and false signals are generated from time to time. Trading in the markets involves huge risks and one should always do his/her own research before making any trading decisions. This indicator is only designed to help you make a trading decision.
סקריפט להזמנה בלבד
הגישה לסקריפט זה מוגבלת למשתמשים שהוסמכו על ידי הכותב ובדרך כלל דורשת תשלום. אתה יכול להוסיף אותו למועדפים שלך, אך תוכל להשתמש בו רק לאחר שתבקש אישור ותקבל אותו מהמחבר שלו. למידע נוסף, צור קשר עם skynet970, או עקוב אחר הוראות המחבר למטה.
TradingView לא מציעה לשלם עבור סקריפט ולהשתמש בו אלא אם כן אתה סומך ב-100% על המחבר שלו ומבין כיצד הסקריפט עובד. במקרים רבים, אתה יכול למצוא אלטרנטיבה טובה לקוד פתוח בחינם בבסקריפטים הקהילתיים שלנו.
הוראות המחבר
″You can get this indicator by leaving me a private message on tradingview.
רוצה להשתמש בסקריפ זה בגרף?
אזהרה: נא לקרוא לפני בקשת גישה.
כתב ויתור
המידע והפרסומים אינם אמורים להיות, ואינם מהווים, עצות פיננסיות, השקעות, מסחר או סוגים אחרים של עצות או המלצות שסופקו או מאושרים על ידי TradingView. קרא עוד בתנאים וההגבלות.