OPEN-SOURCE SCRIPT
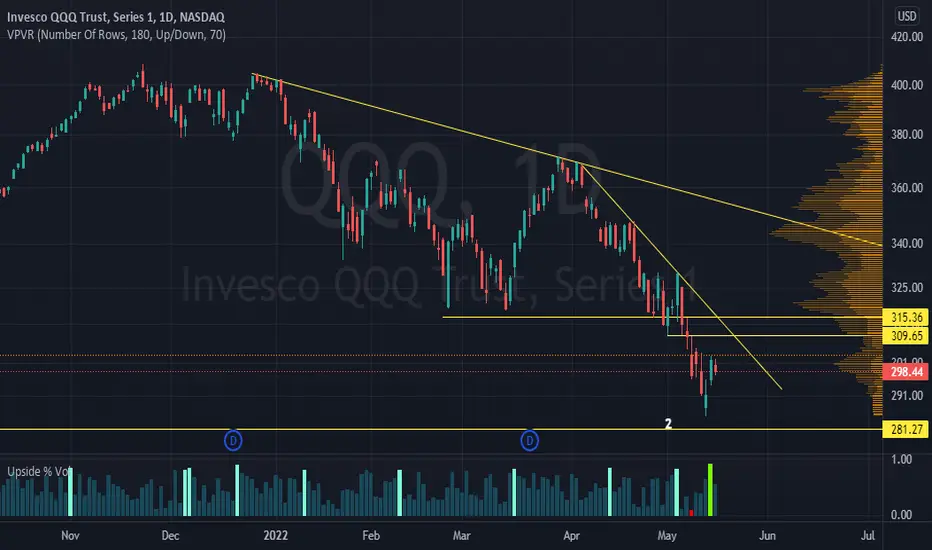
Lowry Upside % Volume

This script takes the total NYSE volume for the day and determines what percentage of that volume is Upside Volume (or buying volume).
What's different in this script compared to others is that the 3 most essential values determined by Paul F. Desmond's Dow Award-winning paper for Lowry's Reports are color coded:
1) 90% Upside Volume Day
2) 80% Upside Volume Day
3) 90% Downside Volume Day
According to Paul's award-winning research, these precise criteria are objective definitions of panic selling and panic buying and are generally near major market tops and bottoms.
His Dow Award-winning paper on the topic can be explored and scrutinized in more detail here:
docs.cmtassociation.org/docs/2002DowAwardb.pdf
סקריפט קוד פתוח
ברוח האמיתית של TradingView, יוצר הסקריפט הזה הפך אותו לקוד פתוח, כך שסוחרים יוכלו לעיין בו ולאמת את פעולתו. כל הכבוד למחבר! אמנם ניתן להשתמש בו בחינם, אך זכור כי פרסום חוזר של הקוד כפוף ל־כללי הבית שלנו.
כתב ויתור
המידע והפרסומים אינם מיועדים להיות, ואינם מהווים, ייעוץ או המלצה פיננסית, השקעתית, מסחרית או מכל סוג אחר המסופקת או מאושרת על ידי TradingView. קרא עוד ב־תנאי השימוש.