OPEN-SOURCE SCRIPT
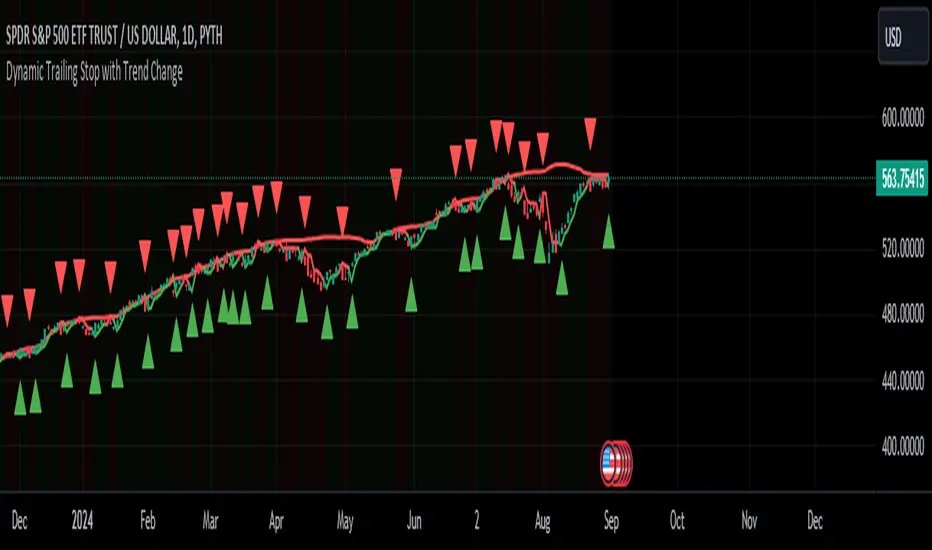
Dynamic Trailing Stop with Trend Change
Key features of this script:
Trend Identification: Uses previous day's high/low breaks to identify trend changes.
Uptrend starts when price closes above the previous day's high.
Downtrend starts when price closes below the previous day's low.
Dynamic Trailing Stop:
In an uptrend, the stop is set to the previous day's low and trails higher.
In a downtrend, the stop is set to the previous day's high and trails lower.
Visual Indicators:
Green triangle for uptrend start, red triangle for downtrend start.
Green/red line for the trailing stop.
Background color changes to light green in uptrends, light red in downtrends.
Alerts:
Trend change alerts when a new trend is identified.
Stop hit alerts when price crosses the trailing stop, suggesting a potential exit.
This implementation allows you to:
Identify trend changes based on previous day's high/low breaks.
Trail your stop loss dynamically as the trend progresses.
Get visual and alert-based signals for trend changes and potential exit points.
For swing trading, you could:
Enter long when an uptrend starts (green triangle).
Set your initial stop loss to the trailing stop (green line).
Exit if the price closes below the trailing stop or a downtrend starts (red triangle).
(Reverse for short trades)
Remember, while this strategy can be effective, it's important to combine it with other forms of analysis and proper risk management. The effectiveness can vary depending on the volatility of the asset and overall market conditions. Always test thoroughly before using in live trading.
סקריפט קוד פתוח
ברוח האמיתית של TradingView, יוצר הסקריפט הזה הפך אותו לקוד פתוח, כך שסוחרים יוכלו לעיין בו ולאמת את פעולתו. כל הכבוד למחבר! אמנם ניתן להשתמש בו בחינם, אך זכור כי פרסום חוזר של הקוד כפוף ל־כללי הבית שלנו.
כתב ויתור
המידע והפרסומים אינם מיועדים להיות, ואינם מהווים, ייעוץ או המלצה פיננסית, השקעתית, מסחרית או מכל סוג אחר המסופקת או מאושרת על ידי TradingView. קרא עוד ב־תנאי השימוש.