OPEN-SOURCE SCRIPT
Custom Group Financials [Technimentals]
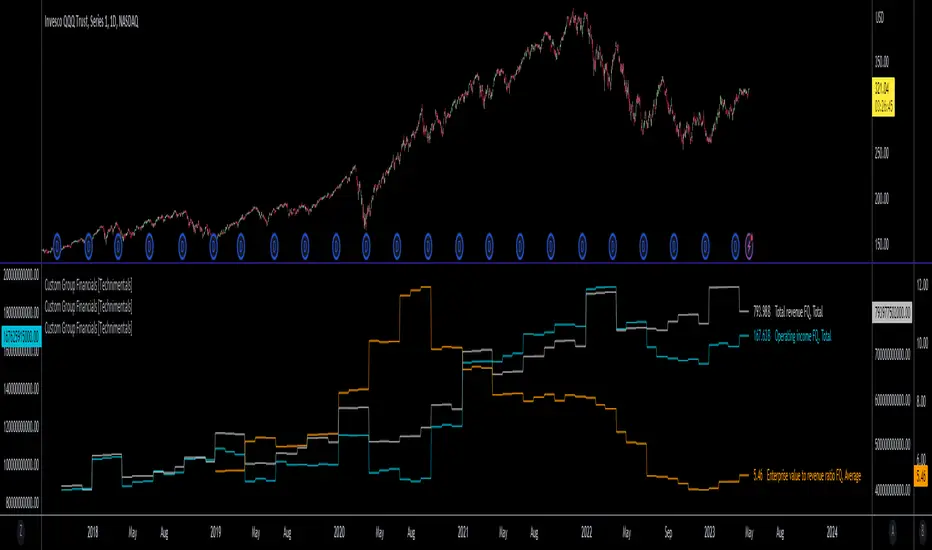
This script allows the user to build custom groups and combine the same financial data from 40 different symbols simultaneously and plot it data as a total or as an average.
By default, the top 40 symbols in the QQQ are used. Between them they account for the majority of the index. This is a good workaround for the lack of ETF financial data in TradingView.
This functions much like any other financial indicator. You choose the financial data and period:
FY = Financial Year
FQ = Financial Quarter
TTM = Trailing Twelve Months
Bare in mind that some data only exists in FY data.
Thanks to LucF for writing most of this code!
Enjoy!
סקריפט קוד פתוח
ברוח האמיתית של TradingView, יוצר הסקריפט הזה הפך אותו לקוד פתוח, כך שסוחרים יוכלו לעיין בו ולאמת את פעולתו. כל הכבוד למחבר! אמנם ניתן להשתמש בו בחינם, אך זכור כי פרסום חוזר של הקוד כפוף ל־כללי הבית שלנו.
כתב ויתור
המידע והפרסומים אינם מיועדים להיות, ואינם מהווים, ייעוץ או המלצה פיננסית, השקעתית, מסחרית או מכל סוג אחר המסופקת או מאושרת על ידי TradingView. קרא עוד ב־תנאי השימוש.