OPEN-SOURCE SCRIPT
מעודכן Relative chart analysis using arithmetic operators
Relative chart analysis using arithmetic operators.
הערות שחרור
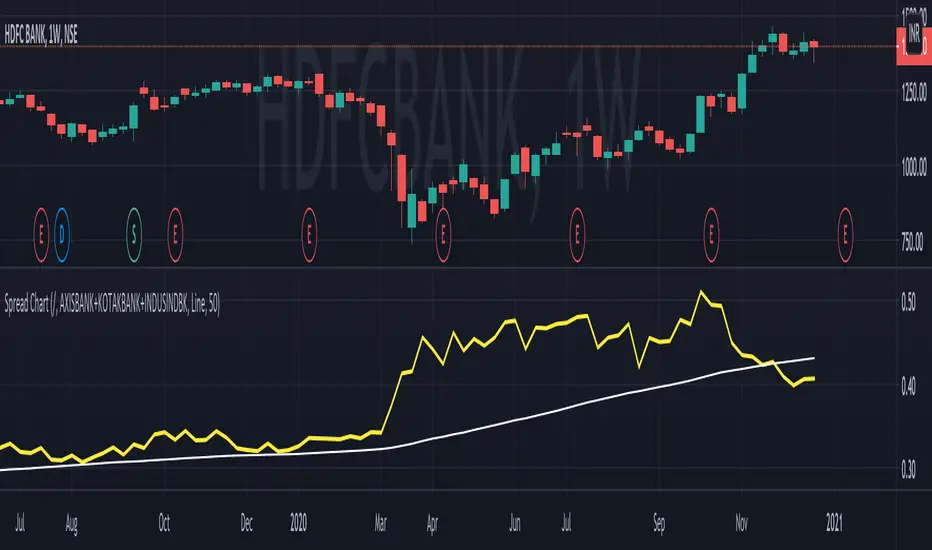
- Now line plots are available and the default option
- The 50 Period Moving Average is also plotted by default
Usage:
On can plot a combination of number of mathematical operators. The input source, can itself also be a combination of different scrips. For example, in this example, we compare (divide / ) HDFCBANK with a "synthetic benchmark" of other competing private banks by combining (AXIS + KOTAK + INDUSIND) in the input.
סקריפט קוד פתוח
ברוח האמיתית של TradingView, יוצר הסקריפט הזה הפך אותו לקוד פתוח, כך שסוחרים יוכלו לעיין בו ולאמת את פעולתו. כל הכבוד למחבר! אמנם ניתן להשתמש בו בחינם, אך זכור כי פרסום חוזר של הקוד כפוף ל־כללי הבית שלנו.
כתב ויתור
המידע והפרסומים אינם מיועדים להיות, ואינם מהווים, ייעוץ או המלצה פיננסית, השקעתית, מסחרית או מכל סוג אחר המסופקת או מאושרת על ידי TradingView. קרא עוד ב־תנאי השימוש.