OPEN-SOURCE SCRIPT
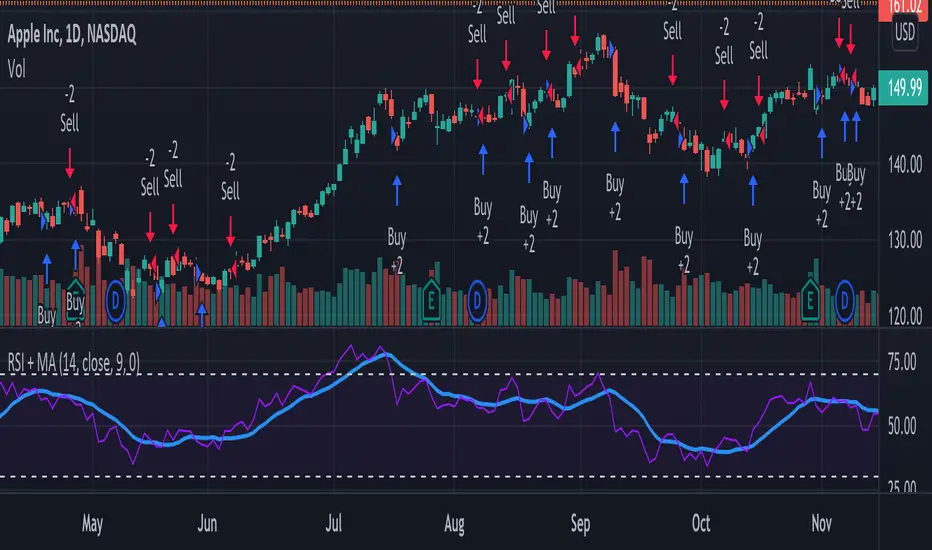
RSI + MA Strategy

Hello, everyone!
We have just released an innovative strategy for TradingView. It allows you to facilitate the trading process when you have to use both indicators.
This strategy is:
Features
The RSI+MA strategy can:
Note! If you want to open a Long position, the RSI line should cross MA from top to bottom. If you want to open a Short position, RSI has to cross MA from bottom to top.
Parameters
We have equipped our strategy with more than 14 additional parameters. So, you can configure the EA according to your needs!
Inputs:
Style:
Note! Try RSI+MA on your demo account first before going live.
We have just released an innovative strategy for TradingView. It allows you to facilitate the trading process when you have to use both indicators.
This strategy is:
- User-friendly
- Configurable
- Equipped with the combination of Relative Strength Index (RSI) and Moving Average (MA) indicators
- Designed with all required functions to manage positions
Features
The RSI+MA strategy can:
- Identify entry points for Long and Short positions.
- Depict RSI and MA values concerning each other.
- Reduce visual congestion and import usability thanks to using a combo of 2 indicators.
- Allow using pivot trading. The RSI+MA strategy will enter a Long position according to the Short position conditions. And vice versa.
Note! If you want to open a Long position, the RSI line should cross MA from top to bottom. If you want to open a Short position, RSI has to cross MA from bottom to top.
Parameters
We have equipped our strategy with more than 14 additional parameters. So, you can configure the EA according to your needs!
Inputs:
- Use Reverse Trade — allows swapping Long and Short positions opening conditions.
- Resolution — allows you to view an indicator with data on a higher or lower timeframe on the current chart.
- RSI Length
- RSI Source: Open, High, Low, Close, HL2, HLC3, OHLC4
- Show MA — allows you to enable or disable MA displaying.
- MA Length
- MA Offset
Style:
- RSI — RSI indicator line color and style settings.
- MA — MA indicator line color and style configuration.
- Upper Band — allows customizing line style, color, and RSI upper bound value.
- Lower Band — allows you to customize line style, color, and RSI lower bound value.
- Background — background color setting within the RSI upper and lower borders.
- Precision — number of decimals for RSI values.
Note! Try RSI+MA on your demo account first before going live.
סקריפט קוד פתוח
ברוח האמיתית של TradingView, יוצר הסקריפט הזה הפך אותו לקוד פתוח, כך שסוחרים יוכלו לעיין בו ולאמת את פעולתו. כל הכבוד למחבר! אמנם ניתן להשתמש בו בחינם, אך זכור כי פרסום חוזר של הקוד כפוף ל־כללי הבית שלנו.
כתב ויתור
המידע והפרסומים אינם מיועדים להיות, ואינם מהווים, ייעוץ או המלצה פיננסית, השקעתית, מסחרית או מכל סוג אחר המסופקת או מאושרת על ידי TradingView. קרא עוד ב־תנאי השימוש.