OPEN-SOURCE SCRIPT
מעודכן Large volume indicator to show the price above/below
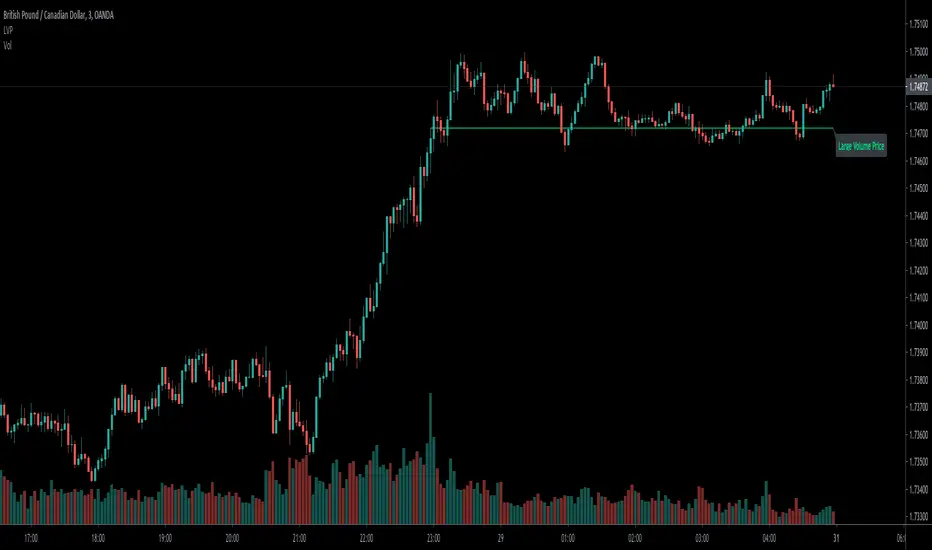
Large volume is meaningful that usually the current price above the highest price of the bars with largest volume usually means uptrend in the short-term.
In the opposite, below it means downtrend.
I coded this indicator to save the efforts to compare it, make it easily to tell the uptrend/downtrend by above/below and color.
Hope you guys enjoy it, and welcome to comment.
The Inputs:
Length:the largest volume of bars of the total bars numbers.
Color:the above/below colors.
Text:Remind this line is large volume R/S.
You can find the video tutorial in my ideas sharing.
הערות שחרור
Hi,Guys,According to feedbacks of invisible,
1.I move the label to the right.
2.The background color of label can be self-defined.
3.Make the line thicker.
Thanks for comment and share how you feel when using it.
הערות שחרור
Hi,guys,According to feedback of indicator, some modified functions as below:
1.Self-defined extend the line to the left largest volume bar or not.(Default is yes)
2.Self-defined the width of line (1-4) to be visible.(Default is 1, thinnest)
Hope you guys enjoy it, and welcome to leave your comments below.
Thanks.
סקריפט קוד פתוח
ברוח האמיתית של TradingView, יוצר הסקריפט הזה הפך אותו לקוד פתוח, כך שסוחרים יוכלו לעיין בו ולאמת את פעולתו. כל הכבוד למחבר! אמנם ניתן להשתמש בו בחינם, אך זכור כי פרסום חוזר של הקוד כפוף ל־כללי הבית שלנו.
כתב ויתור
המידע והפרסומים אינם מיועדים להיות, ואינם מהווים, ייעוץ או המלצה פיננסית, השקעתית, מסחרית או מכל סוג אחר המסופקת או מאושרת על ידי TradingView. קרא עוד ב־תנאי השימוש.