Hello All,
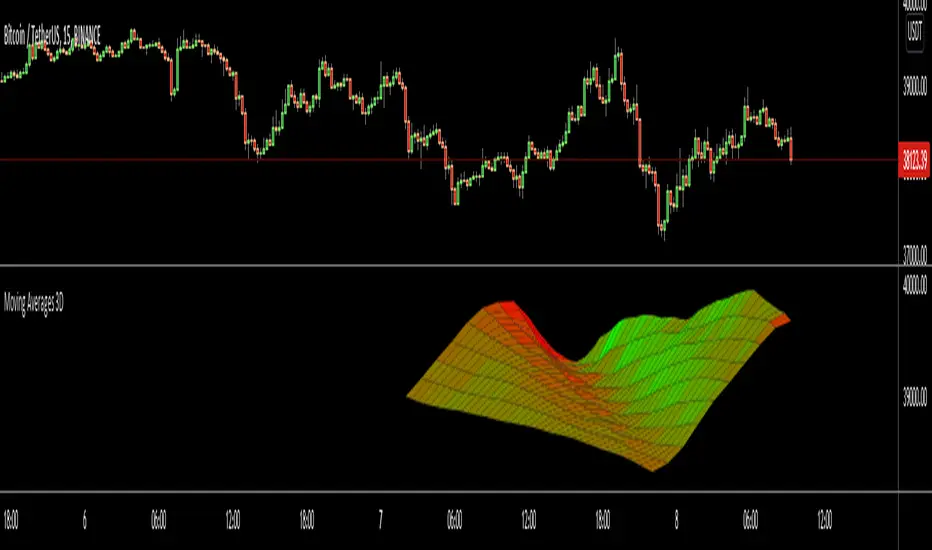
This is an experimental work to show 10 moving averages in 3D by using linefill.new() feature of the Pine language.
You can set moving average type as Simple (SMA) or Exponential (EMA)
You can set "Starting Length" and set the "Step" to calculate other lengths. For example; if "Starting Length" is 10 and "step" is 5 then the lengths are 10, 15, 20, 25...
You can set the colors as Red, Green, Blue for each direction. And you can change the width. you can see the examples below
In following example Green and Blue used:

In following example Blue and Red is used and Width is set as 5:

Enjoy!
This is an experimental work to show 10 moving averages in 3D by using linefill.new() feature of the Pine language.
You can set moving average type as Simple (SMA) or Exponential (EMA)
You can set "Starting Length" and set the "Step" to calculate other lengths. For example; if "Starting Length" is 10 and "step" is 5 then the lengths are 10, 15, 20, 25...
You can set the colors as Red, Green, Blue for each direction. And you can change the width. you can see the examples below
In following example Green and Blue used:
In following example Blue and Red is used and Width is set as 5:
Enjoy!
הערות שחרור
Drawing order and 3d display improvedסקריפט קוד פתוח
ברוח האמיתית של TradingView, יוצר הסקריפט הזה הפך אותו לקוד פתוח, כך שסוחרים יוכלו לעיין בו ולאמת את פעולתו. כל הכבוד למחבר! אמנם ניתן להשתמש בו בחינם, אך זכור כי פרסום חוזר של הקוד כפוף ל־כללי הבית שלנו.
🤝 LonesomeTheBlue community
t.me/LonesomeTheBlue_Official
🎦 YouTube Channel
Youtube.com/@lonesometheblue/videos
💰 Subscription to Pro indicators
Tradingview.com/spaces/LonesomeTheBlue/
t.me/LonesomeTheBlue_Official
🎦 YouTube Channel
Youtube.com/@lonesometheblue/videos
💰 Subscription to Pro indicators
Tradingview.com/spaces/LonesomeTheBlue/
כתב ויתור
המידע והפרסומים אינם מיועדים להיות, ואינם מהווים, ייעוץ או המלצה פיננסית, השקעתית, מסחרית או מכל סוג אחר המסופקת או מאושרת על ידי TradingView. קרא עוד ב־תנאי השימוש.
סקריפט קוד פתוח
ברוח האמיתית של TradingView, יוצר הסקריפט הזה הפך אותו לקוד פתוח, כך שסוחרים יוכלו לעיין בו ולאמת את פעולתו. כל הכבוד למחבר! אמנם ניתן להשתמש בו בחינם, אך זכור כי פרסום חוזר של הקוד כפוף ל־כללי הבית שלנו.
🤝 LonesomeTheBlue community
t.me/LonesomeTheBlue_Official
🎦 YouTube Channel
Youtube.com/@lonesometheblue/videos
💰 Subscription to Pro indicators
Tradingview.com/spaces/LonesomeTheBlue/
t.me/LonesomeTheBlue_Official
🎦 YouTube Channel
Youtube.com/@lonesometheblue/videos
💰 Subscription to Pro indicators
Tradingview.com/spaces/LonesomeTheBlue/
כתב ויתור
המידע והפרסומים אינם מיועדים להיות, ואינם מהווים, ייעוץ או המלצה פיננסית, השקעתית, מסחרית או מכל סוג אחר המסופקת או מאושרת על ידי TradingView. קרא עוד ב־תנאי השימוש.