OPEN-SOURCE SCRIPT
Parabolic SAR BY CARLOZ
🔹 What is the Parabolic SAR?
The Parabolic SAR (developed by Welles Wilder) is a trend-following indicator used to identify potential entry and exit points in the market.
🔹 What does “SAR” mean?
SAR = Stop And Reverse.
It suggests where to place a stop loss and also indicates when to reverse a position (from long to short or short to long).
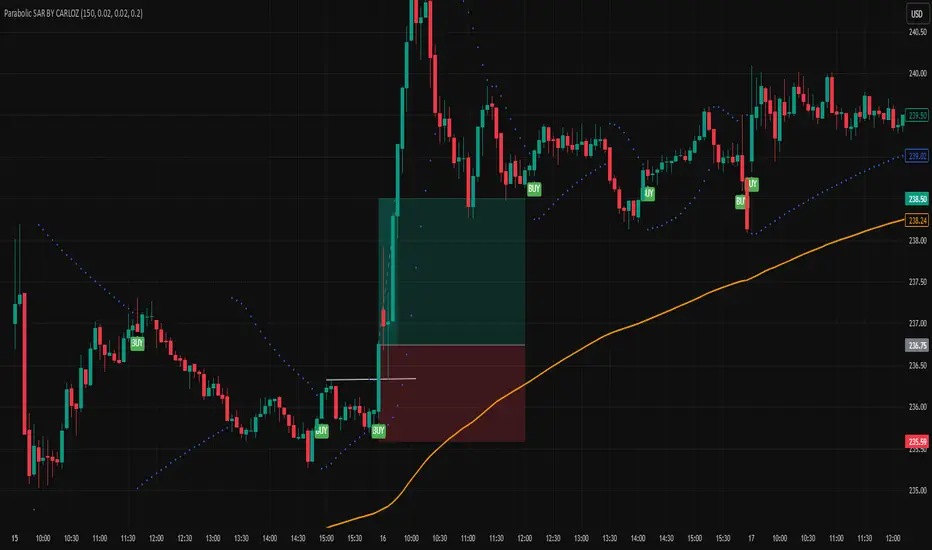
🔹 How does it look on the chart?
It appears as a series of dots above or below the price:
Dots below price → bullish signal (uptrend).
Dots above price → bearish signal (downtrend).
The Parabolic SAR (developed by Welles Wilder) is a trend-following indicator used to identify potential entry and exit points in the market.
🔹 What does “SAR” mean?
SAR = Stop And Reverse.
It suggests where to place a stop loss and also indicates when to reverse a position (from long to short or short to long).
🔹 How does it look on the chart?
It appears as a series of dots above or below the price:
Dots below price → bullish signal (uptrend).
Dots above price → bearish signal (downtrend).
סקריפט קוד פתוח
ברוח האמיתית של TradingView, יוצר הסקריפט הזה הפך אותו לקוד פתוח, כך שסוחרים יוכלו לעיין בו ולאמת את פעולתו. כל הכבוד למחבר! אמנם ניתן להשתמש בו בחינם, אך זכור כי פרסום חוזר של הקוד כפוף ל־כללי הבית שלנו.
כתב ויתור
המידע והפרסומים אינם מיועדים להיות, ואינם מהווים, ייעוץ או המלצה פיננסית, השקעתית, מסחרית או מכל סוג אחר המסופקת או מאושרת על ידי TradingView. קרא עוד ב־תנאי השימוש.