OPEN-SOURCE SCRIPT
US Party Rule Indicator
**Here's a description you can use for the indicator:**
**US Party Rule Indicator**
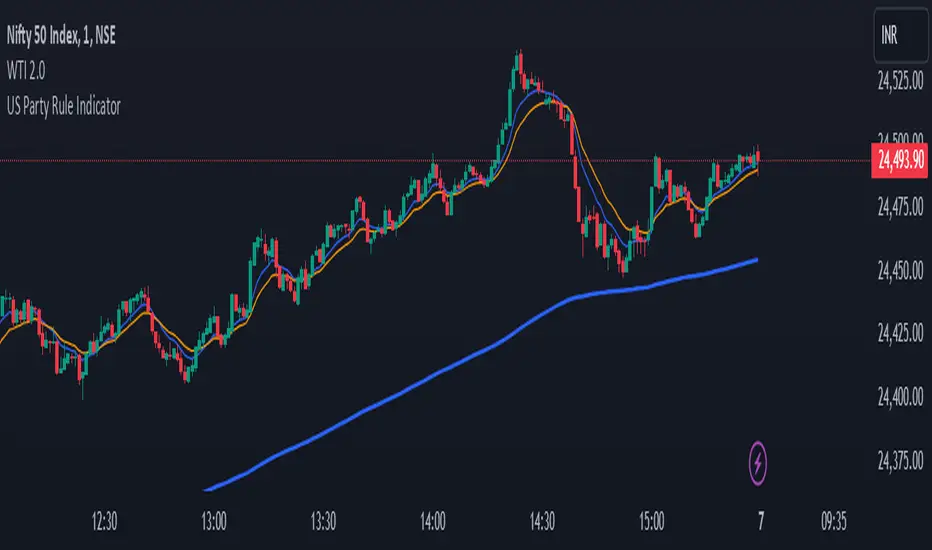
This indicator visually represents the political party in power in the United States over a specified period. It overlays a colored 200-day Exponential Moving Average (EMA) on the chart. The color of the EMA changes to reflect the ruling party, providing a visual representation of political influence on market trends.
**Key Features:**
- **Dynamic Color-Coded EMA:** The 200-EMA changes color to indicate the party in power (Red for Republican, Blue for Democrat).
- **Clear Visual Representation:** The colored EMA provides an easy-to-understand visual cue for identifying periods of different political parties.
- **Historical Context:** By analyzing the historical data, you can gain insights into potential correlations between party rule and market trends.
**How to Use:**
1. **Add the Indicator:** Add the "US Party Rule Indicator" to your chart.
2. **Interpret the Color:** The color of the 200-EMA indicates the ruling party at that time.
3. **Analyze Market Trends:** Use the indicator to identify potential correlations between political events and market movements.
**Note:** This indicator is for informational purposes only and should not be used as the sole basis for investment decisions. Always conduct thorough research and consider consulting with a financial advisor.
**US Party Rule Indicator**
This indicator visually represents the political party in power in the United States over a specified period. It overlays a colored 200-day Exponential Moving Average (EMA) on the chart. The color of the EMA changes to reflect the ruling party, providing a visual representation of political influence on market trends.
**Key Features:**
- **Dynamic Color-Coded EMA:** The 200-EMA changes color to indicate the party in power (Red for Republican, Blue for Democrat).
- **Clear Visual Representation:** The colored EMA provides an easy-to-understand visual cue for identifying periods of different political parties.
- **Historical Context:** By analyzing the historical data, you can gain insights into potential correlations between party rule and market trends.
**How to Use:**
1. **Add the Indicator:** Add the "US Party Rule Indicator" to your chart.
2. **Interpret the Color:** The color of the 200-EMA indicates the ruling party at that time.
3. **Analyze Market Trends:** Use the indicator to identify potential correlations between political events and market movements.
**Note:** This indicator is for informational purposes only and should not be used as the sole basis for investment decisions. Always conduct thorough research and consider consulting with a financial advisor.
סקריפט קוד פתוח
ברוח האמיתית של TradingView, יוצר הסקריפט הזה הפך אותו לקוד פתוח, כך שסוחרים יוכלו לעיין בו ולאמת את פעולתו. כל הכבוד למחבר! אמנם ניתן להשתמש בו בחינם, אך זכור כי פרסום חוזר של הקוד כפוף ל־כללי הבית שלנו.
כתב ויתור
המידע והפרסומים אינם מיועדים להיות, ואינם מהווים, ייעוץ או המלצה פיננסית, השקעתית, מסחרית או מכל סוג אחר המסופקת או מאושרת על ידי TradingView. קרא עוד ב־תנאי השימוש.