OPEN-SOURCE SCRIPT
מעודכן Seasonal Performance for Stocks & Crypto

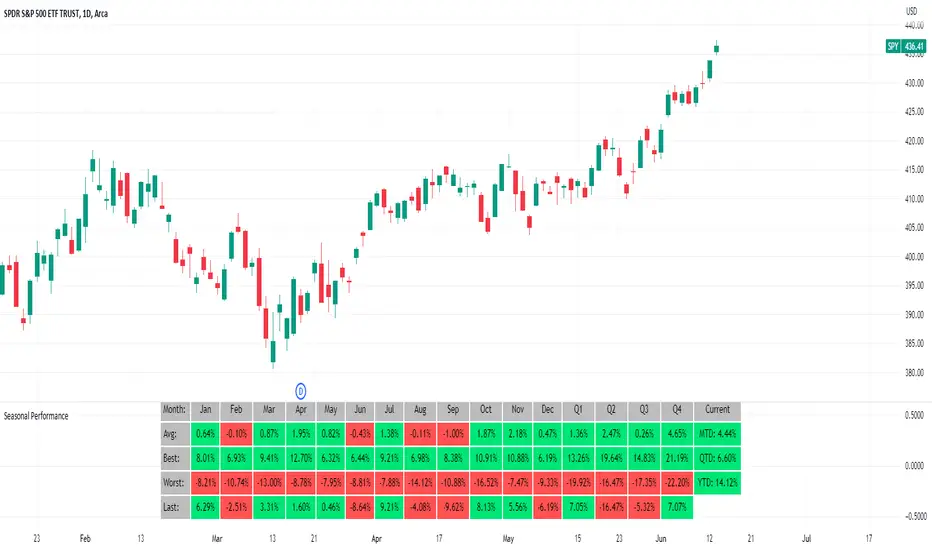
The Seasonal Performance indicator quickly allows you to see if you are in a bullish or bearish time of year for an underlying security and where the current performance stacks up compared to the same time of year historically. Table is fully customizable from colors to what data to see.
Table Displays
Note this indicator will only work with Stocks, ETF's, Index's or Crypto.
Table Displays
- Average Performance
- Best Performance
- Worst Performance
- Last Performance
- Current Performance
Note this indicator will only work with Stocks, ETF's, Index's or Crypto.
הערות שחרור
Added ability to see the number of times each month or quarter was bullish or bearishסקריפט קוד פתוח
ברוח האמיתית של TradingView, יוצר הסקריפט הזה הפך אותו לקוד פתוח, כך שסוחרים יוכלו לעיין בו ולאמת את פעולתו. כל הכבוד למחבר! אמנם ניתן להשתמש בו בחינם, אך זכור כי פרסום חוזר של הקוד כפוף ל־כללי הבית שלנו.
Trusted Pine programmer. Send me a message for script development.
כתב ויתור
המידע והפרסומים אינם מיועדים להיות, ואינם מהווים, ייעוץ או המלצה פיננסית, השקעתית, מסחרית או מכל סוג אחר המסופקת או מאושרת על ידי TradingView. קרא עוד ב־תנאי השימוש.
סקריפט קוד פתוח
ברוח האמיתית של TradingView, יוצר הסקריפט הזה הפך אותו לקוד פתוח, כך שסוחרים יוכלו לעיין בו ולאמת את פעולתו. כל הכבוד למחבר! אמנם ניתן להשתמש בו בחינם, אך זכור כי פרסום חוזר של הקוד כפוף ל־כללי הבית שלנו.
Trusted Pine programmer. Send me a message for script development.
כתב ויתור
המידע והפרסומים אינם מיועדים להיות, ואינם מהווים, ייעוץ או המלצה פיננסית, השקעתית, מסחרית או מכל סוג אחר המסופקת או מאושרת על ידי TradingView. קרא עוד ב־תנאי השימוש.