OPEN-SOURCE SCRIPT
Return & Drawdown
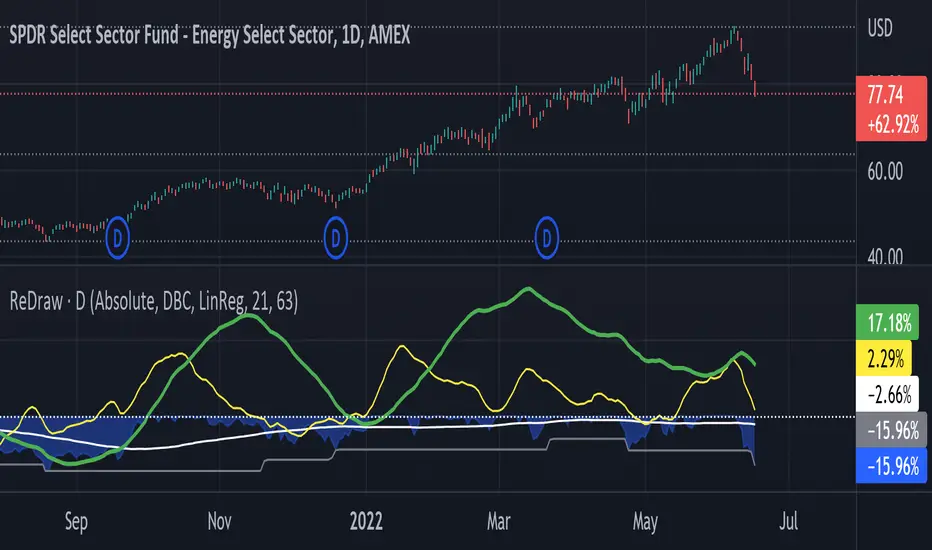
ReDraw script calculates the historical returns and drawdown for the given periods.
By default, the return of the linear regression trends is displayed (can be turned off in settings). In this mode, two linear regression trends are being computed for both long and short periods, and the percent value indicates the "return of the trend" for the corresponding period. Observing the dynamic of the linear regression trends can give a great hint if the trend is slowing down.
When the smoothing method is set to "none" or WMA3/5, the real asset return is shown for both periods, using the formula (LastPrice-FirstPrice)/FirstPrice
The script calculates the maximum drawdown for the long period using the formula (max(Price) - LastPrice) / max(Price).
The white line under the zero is the average maximum drawdown over the long period.
When the mode is set to Compare, ReDraw will display the difference in metrics between the current and selected symbol (SPY by default).
סקריפט קוד פתוח
ברוח האמיתית של TradingView, יוצר הסקריפט הזה הפך אותו לקוד פתוח, כך שסוחרים יוכלו לעיין בו ולאמת את פעולתו. כל הכבוד למחבר! אמנם ניתן להשתמש בו בחינם, אך זכור כי פרסום חוזר של הקוד כפוף ל־כללי הבית שלנו.
כתב ויתור
המידע והפרסומים אינם מיועדים להיות, ואינם מהווים, ייעוץ או המלצה פיננסית, השקעתית, מסחרית או מכל סוג אחר המסופקת או מאושרת על ידי TradingView. קרא עוד ב־תנאי השימוש.