OPEN-SOURCE SCRIPT
Relative Strength Index with Highlights and Success Test
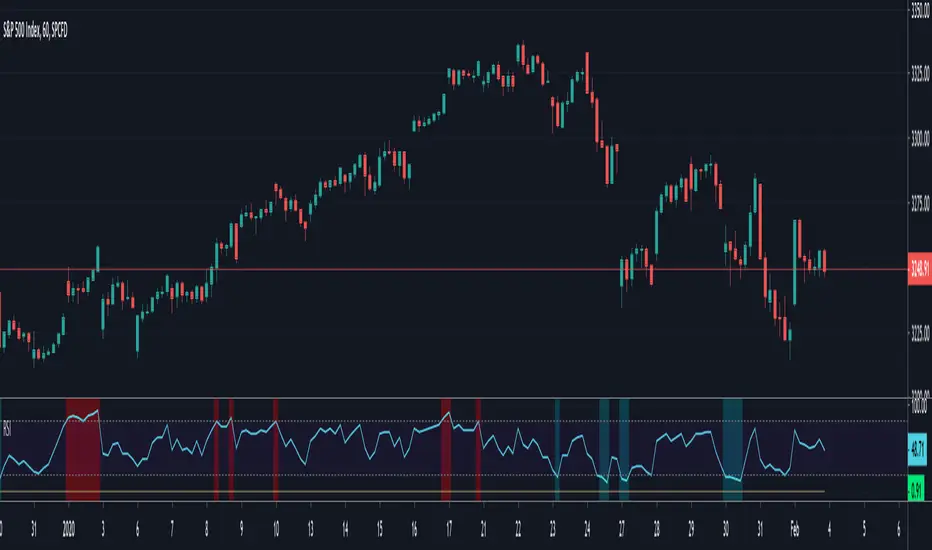
This script does two things:
1- Highlights extreme levels on RSI
2- Calculates what % of the time, price closed higher (lower) with some minimum threshold when RSI was below oversold (overbought) level in a predefined number of bars.
I use this to understand if buying the dip/selling the rip works for a security and on what time frame and if it could be a profitable strategy that can generate large enough moves.
No guarantees on the accuracy of the code. Let me know if you see anything wrong
סקריפט קוד פתוח
ברוח האמיתית של TradingView, יוצר הסקריפט הזה הפך אותו לקוד פתוח, כך שסוחרים יוכלו לעיין בו ולאמת את פעולתו. כל הכבוד למחבר! אמנם ניתן להשתמש בו בחינם, אך זכור כי פרסום חוזר של הקוד כפוף ל־כללי הבית שלנו.
כתב ויתור
המידע והפרסומים אינם מיועדים להיות, ואינם מהווים, ייעוץ או המלצה פיננסית, השקעתית, מסחרית או מכל סוג אחר המסופקת או מאושרת על ידי TradingView. קרא עוד ב־תנאי השימוש.