OPEN-SOURCE SCRIPT
מעודכן 80/20 Rule Indicator
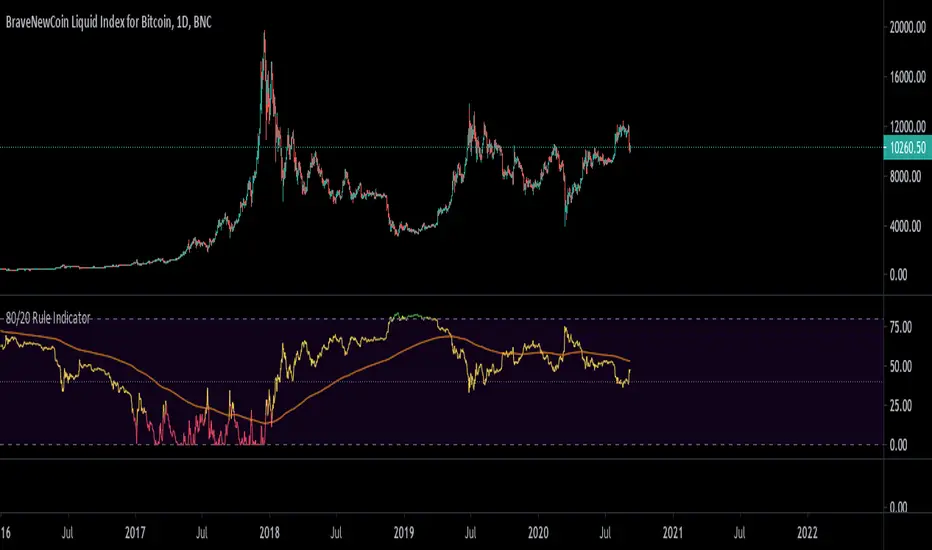
If you have not heard of the 80/20 rule then you are probably living under a rock =).
I took this idea and applied it to total loss percentage from the last known high. As it turns out, after about 80 percent losses on an asset it almost 'always' recovers. Perhaps the theory on this being that 20 percent will just hold on for dear life and never sell =).
For assets that are more established they tend to hit the midline around 40% as good buy zones, like APPL for example, but even APPL (Apple Inc.) in it's infant years hit 80 percent at times and they were always good buy zones. You can see something similar with BTC (Bitcoin) as well.
With the possibility of an upcoming crash in the years ahead you can use this indicator for the asset you are exploring to know with confidence you are buying at a good price zone.
This indicator is obviously meant for long term trading (daily chart or higher). You can use this to look for patterns for how long all-time high's last as well as an idea of when to sell out as well. This gives you a really good overall picture of the asset and it's current position in the price action and where it might be headed.
הערות שחרור
Added color changes for when particular zones are met.הערות שחרור
Added a simple EMA that can be used to trade on crossovers and crossunders.סקריפט קוד פתוח
ברוח האמיתית של TradingView, יוצר הסקריפט הזה הפך אותו לקוד פתוח, כך שסוחרים יוכלו לעיין בו ולאמת את פעולתו. כל הכבוד למחבר! אמנם ניתן להשתמש בו בחינם, אך זכור כי פרסום חוזר של הקוד כפוף ל־כללי הבית שלנו.
-=Gentleman Goat=- Download the TradingView Input Optimizer at tradingtools.software/optimizer
Discord: discord.gg/pGHHRczpbu
Discord: discord.gg/pGHHRczpbu
כתב ויתור
המידע והפרסומים אינם מיועדים להיות, ואינם מהווים, ייעוץ או המלצה פיננסית, השקעתית, מסחרית או מכל סוג אחר המסופקת או מאושרת על ידי TradingView. קרא עוד ב־תנאי השימוש.
סקריפט קוד פתוח
ברוח האמיתית של TradingView, יוצר הסקריפט הזה הפך אותו לקוד פתוח, כך שסוחרים יוכלו לעיין בו ולאמת את פעולתו. כל הכבוד למחבר! אמנם ניתן להשתמש בו בחינם, אך זכור כי פרסום חוזר של הקוד כפוף ל־כללי הבית שלנו.
-=Gentleman Goat=- Download the TradingView Input Optimizer at tradingtools.software/optimizer
Discord: discord.gg/pGHHRczpbu
Discord: discord.gg/pGHHRczpbu
כתב ויתור
המידע והפרסומים אינם מיועדים להיות, ואינם מהווים, ייעוץ או המלצה פיננסית, השקעתית, מסחרית או מכל סוג אחר המסופקת או מאושרת על ידי TradingView. קרא עוד ב־תנאי השימוש.