OPEN-SOURCE SCRIPT
Volume scaled Price + auto colour change light/dark mode

🔶 OVERVIEW
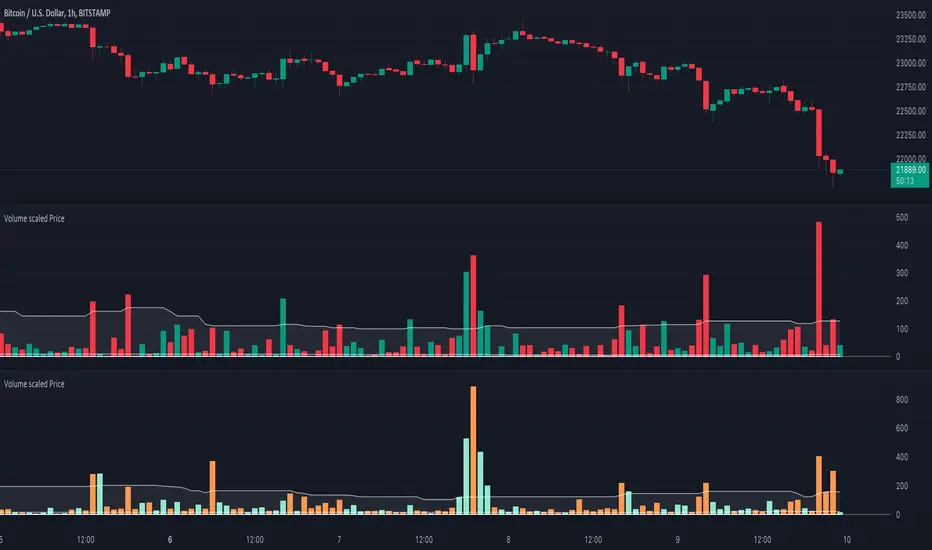
🔹 This script shows price in a similar style as volume. To accomplish this we use the body of the candle (close-open), which is placed on a zero line.

This can be useful when comparing volume ~ price.
🔹 3 options are included to show additional lines, to make comparisons easier:
· Percentile nearest rank
· Bollinger Bands (BB)
· Simple Moving Average (SMA)
🔶 SETTINGS
🔹 Option: choose whether to show price (candles) or volume . Adding 2 versions of this indicator on the chart enables you to compare these 2 options:

🔹 Lines:
· (Percentile nearest rank (only the setting mult is used for this option).

· Bollinger Bands (BB) (only the setting % perc. nearest rank is used for this option).

· Simple Moving Average (SMA )

All 3 options will use length, this is the amount of bars used for calculations.
🔹 Show wick will show you... wicks :)
🔶 PERCENTILE NEAREST RANK


🔹 This script has 2 extra types of background color
Pine Script®
· In this case:
· volume is higher than previous volume (volume > volume[1])
· volume is above 90th percentile rank (volume > prV)
· price is lower than previous price (z < z[1])
· price is below 10th percentile rank (z < prP_)


Pine Script®
· The second type background color is reversed (volume lower, price higher)

🔶 AUTOMATIC COLOUR CHANGE WHEN SWITCHING DARK/LIGHT MODE
🔹 chart.bg_color returns the color of the chart’s background from the "Chart settings/Appearance/Background" field, while chart.fg_color returns a color providing optimal contrast with chart.bg_color.
· Following technique gives you the possibility to pick your own colour for either dark/light time.
· We first retrieve separately the red, green and blue component of the measured chart.bg_color
Pine Script®
The following assumption states when all 3 colour components' values are below 80, we are in the dark mode:
Pine Script®
Now we can use isDark to automatically show your own dark/light mode colours (chosen at settings), dependable on the mode:


Cheers!
🔹 This script shows price in a similar style as volume. To accomplish this we use the body of the candle (close-open), which is placed on a zero line.
This can be useful when comparing volume ~ price.
🔹 3 options are included to show additional lines, to make comparisons easier:
· Percentile nearest rank
· Bollinger Bands (BB)
· Simple Moving Average (SMA)
🔶 SETTINGS
🔹 Option: choose whether to show price (candles) or volume . Adding 2 versions of this indicator on the chart enables you to compare these 2 options:
🔹 Lines:
· (Percentile nearest rank (only the setting mult is used for this option).
· Bollinger Bands (BB) (only the setting % perc. nearest rank is used for this option).
· Simple Moving Average (SMA )
All 3 options will use length, this is the amount of bars used for calculations.
🔹 Show wick will show you... wicks :)
🔶 PERCENTILE NEAREST RANK
🔹 This script has 2 extra types of background color
dvP = volume > volume [1] and z < z [1] and z < prP_ and volume > prV
· In this case:
· volume is higher than previous volume (volume > volume[1])
· volume is above 90th percentile rank (volume > prV)
· price is lower than previous price (z < z[1])
· price is below 10th percentile rank (z < prP_)
dvV = volume < volume [1] and z > z [1] and z > prP and volume < prV_
· The second type background color is reversed (volume lower, price higher)
🔶 AUTOMATIC COLOUR CHANGE WHEN SWITCHING DARK/LIGHT MODE
🔹 chart.bg_color returns the color of the chart’s background from the "Chart settings/Appearance/Background" field, while chart.fg_color returns a color providing optimal contrast with chart.bg_color.
· Following technique gives you the possibility to pick your own colour for either dark/light time.
· We first retrieve separately the red, green and blue component of the measured chart.bg_color
r = color.r(chart.bg_color)
g = color.g(chart.bg_color)
b = color.b(chart.bg_color)
The following assumption states when all 3 colour components' values are below 80, we are in the dark mode:
isDark = r < 80 and g < 80 and b < 80
Now we can use isDark to automatically show your own dark/light mode colours (chosen at settings), dependable on the mode:
Cheers!
סקריפט קוד פתוח
ברוח האמיתית של TradingView, יוצר הסקריפט הזה הפך אותו לקוד פתוח, כך שסוחרים יוכלו לעיין בו ולאמת את פעולתו. כל הכבוד למחבר! אמנם ניתן להשתמש בו בחינם, אך זכור כי פרסום חוזר של הקוד כפוף ל־כללי הבית שלנו.
Who are PineCoders?
tradingview.com/chart/SSP/yW5eOqtm-Who-are-PineCoders/
TG Pine Script® Q&A: t.me/PineCodersQA
- We cannot control our emotions,
but we can control our keyboard -
tradingview.com/chart/SSP/yW5eOqtm-Who-are-PineCoders/
TG Pine Script® Q&A: t.me/PineCodersQA
- We cannot control our emotions,
but we can control our keyboard -
כתב ויתור
המידע והפרסומים אינם מיועדים להיות, ואינם מהווים, ייעוץ או המלצה פיננסית, השקעתית, מסחרית או מכל סוג אחר המסופקת או מאושרת על ידי TradingView. קרא עוד ב־תנאי השימוש.