OPEN-SOURCE SCRIPT
מעודכן Bitcoin M2 supply adjusted price

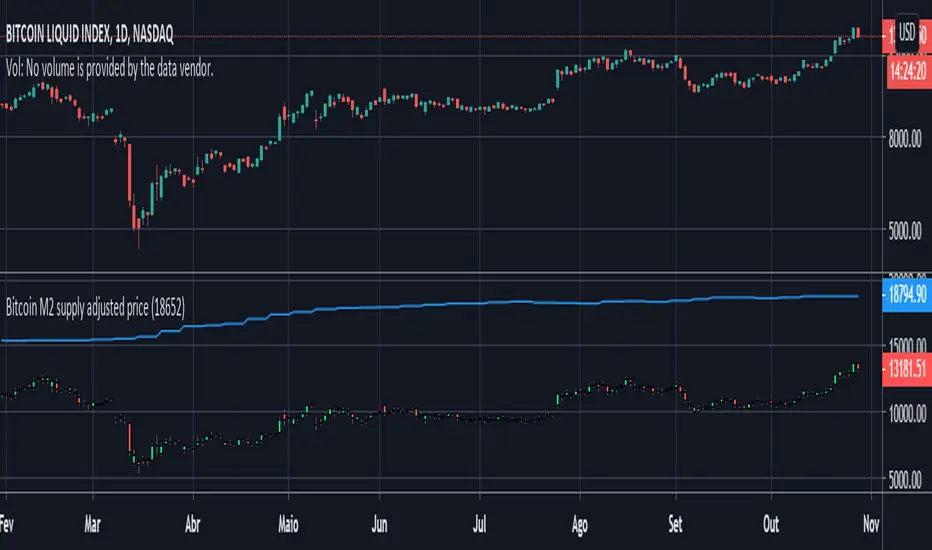
This script plots bitcoin candles adjusted by M2 supply (blue line), helping the trader to obtain insight of new support/resistance levels adjusted by M2 supply.
Note: As it was not possible to make the price adjust automatically by the last M2 value (pinescript limitation, I guess), the input parameter "M2Last" must be updated manually observing the last M2 value in blue curve.
Note: As it was not possible to make the price adjust automatically by the last M2 value (pinescript limitation, I guess), the input parameter "M2Last" must be updated manually observing the last M2 value in blue curve.
הערות שחרור
Adjusted to show more clean graphics in order to comply with Pine script publishing policiesסקריפט קוד פתוח
ברוח האמיתית של TradingView, יוצר הסקריפט הזה הפך אותו לקוד פתוח, כך שסוחרים יוכלו לעיין בו ולאמת את פעולתו. כל הכבוד למחבר! אמנם ניתן להשתמש בו בחינם, אך זכור כי פרסום חוזר של הקוד כפוף ל־כללי הבית שלנו.
כתב ויתור
המידע והפרסומים אינם מיועדים להיות, ואינם מהווים, ייעוץ או המלצה פיננסית, השקעתית, מסחרית או מכל סוג אחר המסופקת או מאושרת על ידי TradingView. קרא עוד ב־תנאי השימוש.
סקריפט קוד פתוח
ברוח האמיתית של TradingView, יוצר הסקריפט הזה הפך אותו לקוד פתוח, כך שסוחרים יוכלו לעיין בו ולאמת את פעולתו. כל הכבוד למחבר! אמנם ניתן להשתמש בו בחינם, אך זכור כי פרסום חוזר של הקוד כפוף ל־כללי הבית שלנו.
כתב ויתור
המידע והפרסומים אינם מיועדים להיות, ואינם מהווים, ייעוץ או המלצה פיננסית, השקעתית, מסחרית או מכל סוג אחר המסופקת או מאושרת על ידי TradingView. קרא עוד ב־תנאי השימוש.