OPEN-SOURCE SCRIPT
USDT.D + USDT.C ALL TIMEFRAMES
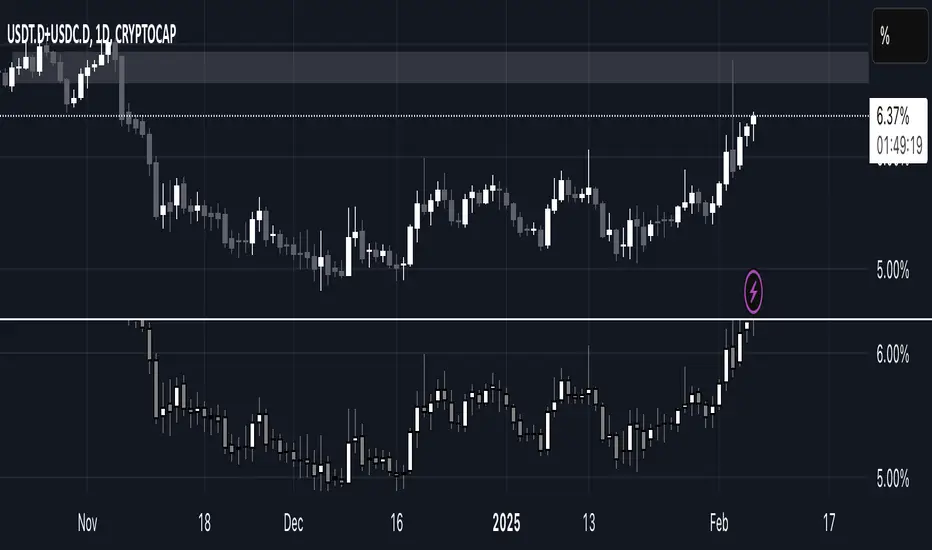
This indicator combines the dominance of USDT (USDT.D) and USDC (USDC.D) to track total stablecoin market share across all timeframes. It displays the combined dominance as candlesticks, providing a clearer view of market liquidity shifts and investor sentiment.
📌 How to Use:
Green candles indicate rising stablecoin dominance (potential risk-off sentiment).
Red candles indicate declining stablecoin dominance (potential risk-on sentiment).
Works on all timeframes, from intraday scalping to macro trend analysis.
This tool is essential for traders looking to analyze stablecoin liquidity flow, identify market turning points, and refine trading strategies based on stablecoin dominance behavior. 🚀
סקריפט קוד פתוח
ברוח האמיתית של TradingView, יוצר הסקריפט הזה הפך אותו לקוד פתוח, כך שסוחרים יוכלו לעיין בו ולאמת את פעולתו. כל הכבוד למחבר! אמנם ניתן להשתמש בו בחינם, אך זכור כי פרסום חוזר של הקוד כפוף ל־כללי הבית שלנו.
כתב ויתור
המידע והפרסומים אינם מיועדים להיות, ואינם מהווים, ייעוץ או המלצה פיננסית, השקעתית, מסחרית או מכל סוג אחר המסופקת או מאושרת על ידי TradingView. קרא עוד ב־תנאי השימוש.