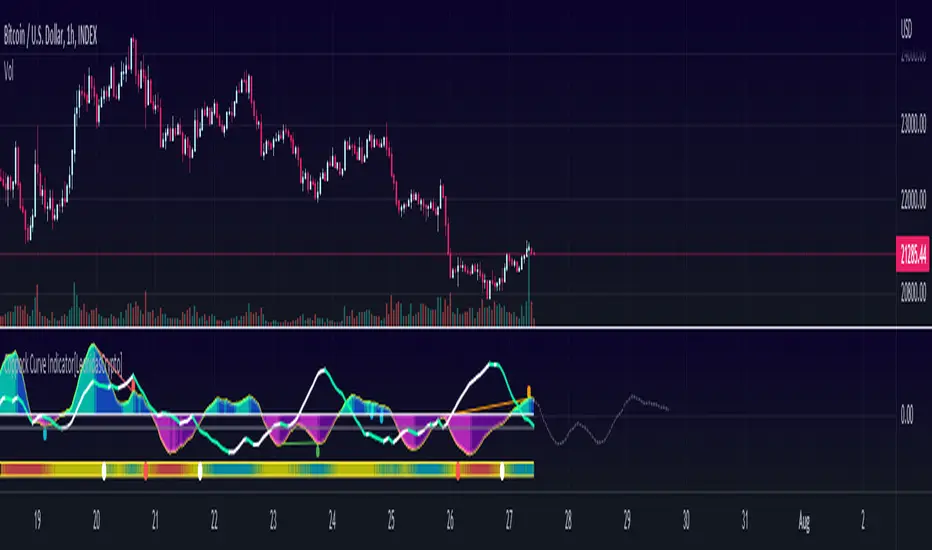
Momentum Indicator [LeonidasCrypto]

Coppock Curve Indicator Summary
The Coppock Curve (CC) was introduced by economist Edwin Coppock in an October 1962 issue of Barron's
While useful, the indicator is not commonly discussed among traders and investors. Traditionally used to spot long-term trend changes in major stock indexes, traders can use the indicator for any time and in any market to isolate potential trend shifts and generate trade signals.
How to use it:
0 line is the key level Above 0 line the momentum is getting strong(bullish) below 0 line the momentum is weak(bearish)
Buy signal:
In combination with ADX, Volatility :
Wait for the curve color turning to Dark Purple(weak bearish momentum) and ADX slope in the opposite side of the trend
Sell Signal.
Wait for the curve color turning to Dark Blue (weak bull momentum) and ADX slope in the opposite side of the trend
Explosive Moves.
This indicator will help you to catch explosive moves :
Wait for the bar in the bottom of the indicator[Volatility Bar] turned blue color[Consolidation] low volatility. Enter in the next buy/sell signal following the rules I described above using this strategy you will catch in many cases very good move.
Divergences:
This indicator will help you to identify divergences
Combine the divergences generated by this indicator with the sell/bull signals to increase the probabilities for a good trade setup.
Now you can see the current value of ADX
Bearish/Bullish Curve
Background panel will change the color same as the Curve(Momentum)
Added cross points in the Volatility Bar with this information you will know when volatility is expanding/contracting.
סקריפט להזמנה בלבד
רק משתמשים שאושרו על ידי המחבר יכולים לגשת לסקריפט הזה. יהיה עליך לשלוח בקשת גישה ולקבל אישור לשימוש. בדרך כלל, הגישה ניתנת לאחר תשלום. למידע נוסף, עקוב אחר ההוראות של היוצר בהמשך או צור קשר עם LeonidasCrypto ישירות.
TradingView לא ממליצה לשלם עבור סקריפט או להשתמש בו אלא אם כן אתה סומך לחלוטין על המחבר שלו ומבין כיצד הוא פועל. ייתכן שתוכל גם למצוא חלופות חינמיות וקוד פתוח ב-סקריפטים הקהילתיים שלנו.
הוראות המחבר
כתב ויתור
סקריפט להזמנה בלבד
רק משתמשים שאושרו על ידי המחבר יכולים לגשת לסקריפט הזה. יהיה עליך לשלוח בקשת גישה ולקבל אישור לשימוש. בדרך כלל, הגישה ניתנת לאחר תשלום. למידע נוסף, עקוב אחר ההוראות של היוצר בהמשך או צור קשר עם LeonidasCrypto ישירות.
TradingView לא ממליצה לשלם עבור סקריפט או להשתמש בו אלא אם כן אתה סומך לחלוטין על המחבר שלו ומבין כיצד הוא פועל. ייתכן שתוכל גם למצוא חלופות חינמיות וקוד פתוח ב-סקריפטים הקהילתיים שלנו.