Eagles Compass
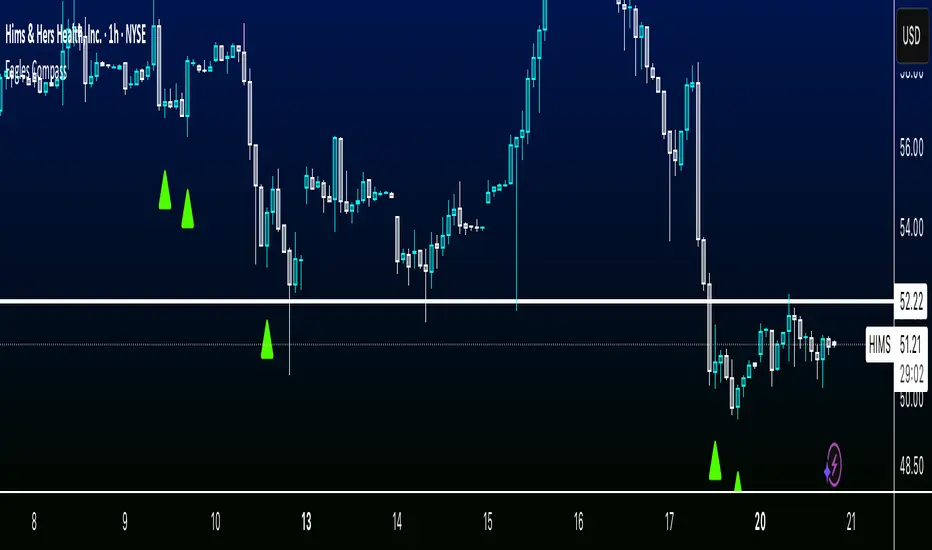
1HR, 2HR, 1D timeframe swing analysis script designed to help you spot squeezes, reversals, and large moves
Some stocks will work better on the 1HR timeframe, other stocks will have to be adjsuted to the 2HR or 1D timeframe based on volatility and average volume of the stock
There are some false positives as with any indicator. This is how you spot them:
If a red triangle appears near a support or new low and the stock is down quite a bit, or if it appears after the stock has already been down trending, it is invalid.
If a green triangle appears near a resistance or new high and the stock is already up a lot, or if it appears that the stock has been up trending for a while, it is invalid.
How does it work?
It's looking at key supports and resistances, reversal zones, and candle ratios to determine potential candles that might indicate an upcoming future move.
סקריפט להזמנה בלבד
רק משתמשים שאושרו על ידי המחבר יכולים לגשת לסקריפט הזה. תצטרך לבקש ולקבל אישור להשתמש בו. אישור זה ניתן בדרך כלל לאחר תשלום. לפרטים נוספים, בצע את ההוראות של המחבר למטה או צור קשר ישירות עם zenmarkets.
TradingView לא ממליצה לשלם עבור סקריפט או להשתמש בו, אלא אם כן אתה סומך לחלוטין על המחבר שלו ומבין איך הוא עובד. ייתכן שתמצא גם אלטרנטיבות חינמיות בקוד פתוח בסקריפטים של הקהילה שלנו.
הוראות המחבר
כתב ויתור
סקריפט להזמנה בלבד
רק משתמשים שאושרו על ידי המחבר יכולים לגשת לסקריפט הזה. תצטרך לבקש ולקבל אישור להשתמש בו. אישור זה ניתן בדרך כלל לאחר תשלום. לפרטים נוספים, בצע את ההוראות של המחבר למטה או צור קשר ישירות עם zenmarkets.
TradingView לא ממליצה לשלם עבור סקריפט או להשתמש בו, אלא אם כן אתה סומך לחלוטין על המחבר שלו ומבין איך הוא עובד. ייתכן שתמצא גם אלטרנטיבות חינמיות בקוד פתוח בסקריפטים של הקהילה שלנו.