OPEN-SOURCE SCRIPT
Price equilibrium between buyers and sellers [Soroush Rezaei]
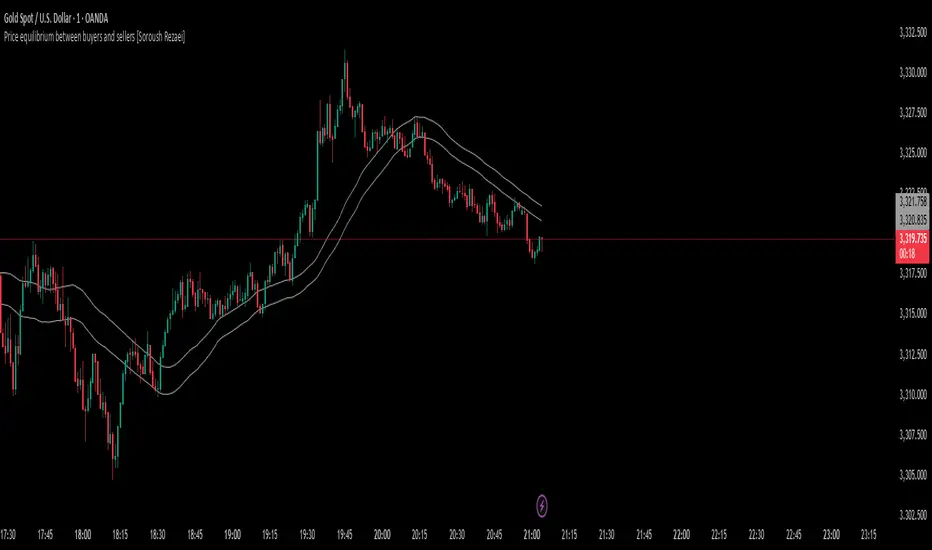
This indicator visualizes the dynamic balance between buyers and sellers using two simple moving averages (SMAs) based on the high and low prices.
The green line (SMA of highs) reflects the upper pressure zone, while the red line (SMA of lows) represents the lower support zone.
When price hovers between these two levels, it often signals a state of temporary equilibrium — a consolidation zone where buyers and sellers are relatively balanced.
Use this tool to:
Recommended for intraday and swing traders seeking visual clarity on market structure and momentum zones.
The green line (SMA of highs) reflects the upper pressure zone, while the red line (SMA of lows) represents the lower support zone.
When price hovers between these two levels, it often signals a state of temporary equilibrium — a consolidation zone where buyers and sellers are relatively balanced.
Use this tool to:
- Identify ranging or balanced market phases
- Spot potential breakout or reversal zones
- Enhance your multi-timeframe or price action strategy
Recommended for intraday and swing traders seeking visual clarity on market structure and momentum zones.
סקריפט קוד פתוח
ברוח האמיתית של TradingView, יוצר הסקריפט הזה הפך אותו לקוד פתוח, כך שסוחרים יוכלו לעיין בו ולאמת את פעולתו. כל הכבוד למחבר! אמנם ניתן להשתמש בו בחינם, אך זכור כי פרסום חוזר של הקוד כפוף ל־כללי הבית שלנו.
כתב ויתור
המידע והפרסומים אינם מיועדים להיות, ואינם מהווים, ייעוץ או המלצה פיננסית, השקעתית, מסחרית או מכל סוג אחר המסופקת או מאושרת על ידי TradingView. קרא עוד ב־תנאי השימוש.