Buy and Sell scanner by ThunderTrader
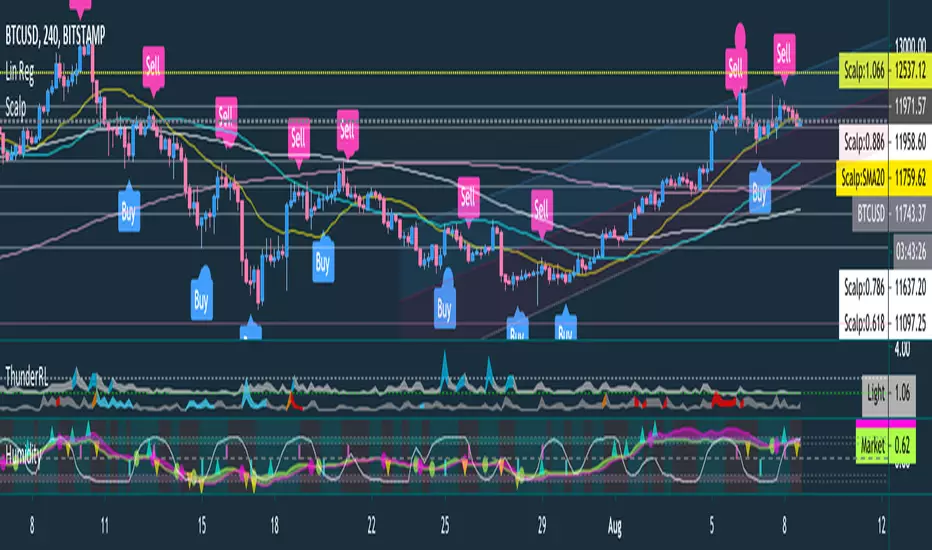
Stocashtic RSI: is provided as background color, where the green is uptrend and the orange is downtrend
Buy/Sell Pole: the red line from top is signal for sell and green line from bottom is signal for buy
Humidity Ribbon: is price trend ribbon, if the ribbon touch or cross-down the bottom area (the red zone), means accumulation is started and best area to buy, but when ribbon touch cross up the top area (blue zone), means the uptrend is very strong. Ribbon cross down from top area can be used as breakout to sell and also ribbon cross up from bottom area can be used as breakout to buy.
Market Wave: is market circulation where 1 top and 1 bottom are equal to 1 circulation, if 1 circulation is ended then it will be best position to buy or if line touches the bottom, it can be used to buy and vice versa
Alert Pole Buy
Alert Pole Sell
Alert Bullish Surplus
Alert Bullish Hyper
Alert Bullish Starts
Alert Liquidation Out
Alert Correction Starts
Alert Bearish Starts
Alert Liquidation Starts
Alert Liquidation Extreme
סקריפט להזמנה בלבד
רק משתמשים שאושרו על ידי המחבר יכולים לגשת לסקריפט הזה. יהיה עליך לשלוח בקשת גישה ולקבל אישור לשימוש. בדרך כלל, הגישה ניתנת לאחר תשלום. למידע נוסף, עקוב אחר ההוראות של היוצר בהמשך או צור קשר עם deSultanTM ישירות.
TradingView לא ממליצה לשלם עבור סקריפט או להשתמש בו אלא אם כן אתה סומך לחלוטין על המחבר שלו ומבין כיצד הוא פועל. ייתכן שתוכל גם למצוא חלופות חינמיות וקוד פתוח ב-סקריפטים הקהילתיים שלנו.
הוראות המחבר
כתב ויתור
סקריפט להזמנה בלבד
רק משתמשים שאושרו על ידי המחבר יכולים לגשת לסקריפט הזה. יהיה עליך לשלוח בקשת גישה ולקבל אישור לשימוש. בדרך כלל, הגישה ניתנת לאחר תשלום. למידע נוסף, עקוב אחר ההוראות של היוצר בהמשך או צור קשר עם deSultanTM ישירות.
TradingView לא ממליצה לשלם עבור סקריפט או להשתמש בו אלא אם כן אתה סומך לחלוטין על המחבר שלו ומבין כיצד הוא פועל. ייתכן שתוכל גם למצוא חלופות חינמיות וקוד פתוח ב-סקריפטים הקהילתיים שלנו.