OPEN-SOURCE SCRIPT
Rainbow Fisher - AYNET
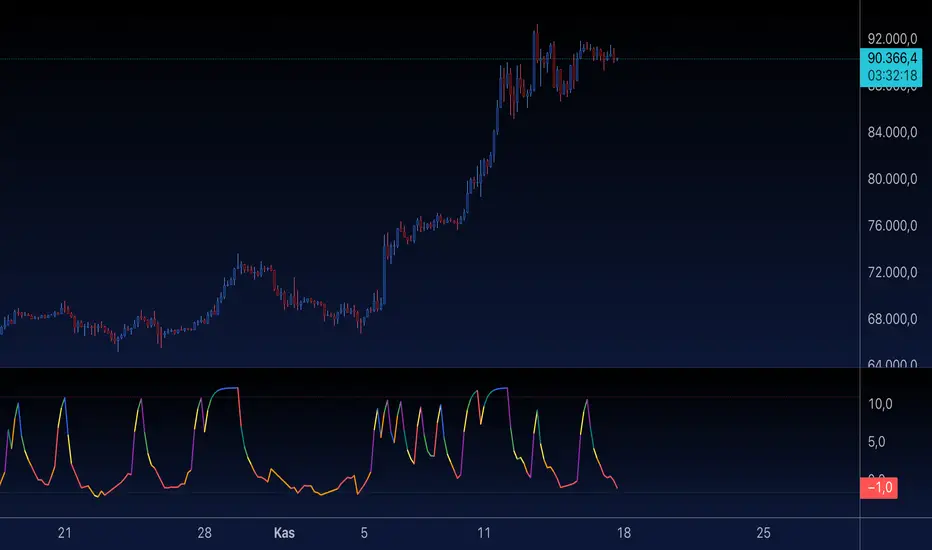
The Rainbow Fisher Indicator is inspired by John Ehlers' work on the Fisher Transform, a tool designed to normalize price movements and highlight overbought and oversold conditions. This script combines Ehlers' Fisher Transform with a rainbow visualization for enhanced trend analysis.
Summary of the Code
Fisher Transform Calculation:
The indicator calculates the Fisher Transform based on normalized high-low price data (hl2), which emphasizes turning points in market trends.
Rainbow Visualization:
The Fisher line is dynamically colored using a rainbow gradient to visually represent the magnitude and direction of market movements.
Overbought/Oversold Levels:
Configurable horizontal lines mark thresholds (1.5 for overbought and -1.5 for oversold by default), helping traders identify extremes in price action.
Signal Labels:
Labels are displayed when the Fisher line crosses the overbought or oversold levels, providing clear visual cues for potential market reversals.
Acknowledgment:
This indicator is an homage to John Ehlers' groundbreaking work in digital signal processing for financial markets.
How to Use
Trend Reversal Detection:
Use the overbought and oversold levels to identify potential turning points in market trends.
Momentum Analysis:
Observe the rainbow-colored Fisher line for directional cues and the strength of price movements.
Customization
Adjust the Fisher Transform length to refine sensitivity.
Modify overbought/oversold levels to align with your trading strategy.
Enable or disable the rainbow effect for simplicity or added clarity.
Let me know if you’d like further refinements or additional features! 🌈
סקריפט קוד פתוח
ברוח האמיתית של TradingView, יוצר הסקריפט הזה הפך אותו לקוד פתוח, כך שסוחרים יוכלו לעיין בו ולאמת את פעולתו. כל הכבוד למחבר! אמנם ניתן להשתמש בו בחינם, אך זכור כי פרסום חוזר של הקוד כפוף ל־כללי הבית שלנו.
כתב ויתור
המידע והפרסומים אינם מיועדים להיות, ואינם מהווים, ייעוץ או המלצה פיננסית, השקעתית, מסחרית או מכל סוג אחר המסופקת או מאושרת על ידי TradingView. קרא עוד ב־תנאי השימוש.