PROTECTED SOURCE SCRIPT
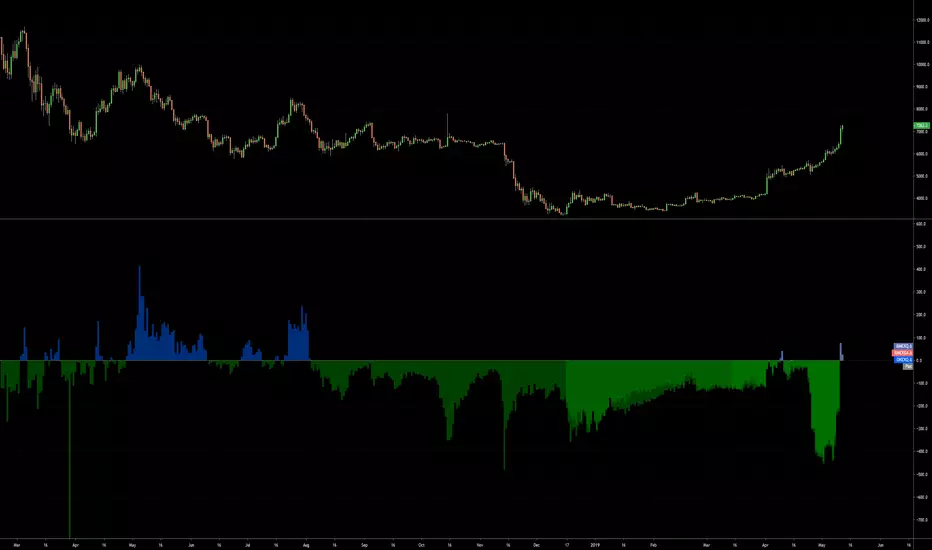
מעודכן Combined BTC Futures vs. Spot {C_S}

I built a baseline histogram chart that allows you to quickly view OKEX, BITMEX Quarts, and BITMEX Bi-Annuals versus spot. Colors are all editable, and you can change to area/line if youd like!
Let me know if you have any questions or suggestions!
Let me know if you have any questions or suggestions!
הערות שחרור
Updated to current contractsהערות שחרור
Dictation editסקריפט מוגן
סקריפט זה פורסם כמקור סגור. עם זאת, תוכל להשתמש בו בחופשיות וללא כל מגבלות – למד עוד כאן
כתב ויתור
המידע והפרסומים אינם מיועדים להיות, ואינם מהווים, ייעוץ או המלצה פיננסית, השקעתית, מסחרית או מכל סוג אחר המסופקת או מאושרת על ידי TradingView. קרא עוד ב־תנאי השימוש.
סקריפט מוגן
סקריפט זה פורסם כמקור סגור. עם זאת, תוכל להשתמש בו בחופשיות וללא כל מגבלות – למד עוד כאן
כתב ויתור
המידע והפרסומים אינם מיועדים להיות, ואינם מהווים, ייעוץ או המלצה פיננסית, השקעתית, מסחרית או מכל סוג אחר המסופקת או מאושרת על ידי TradingView. קרא עוד ב־תנאי השימוש.