OPEN-SOURCE SCRIPT
מעודכן EBL - Enhanced BOS Logic
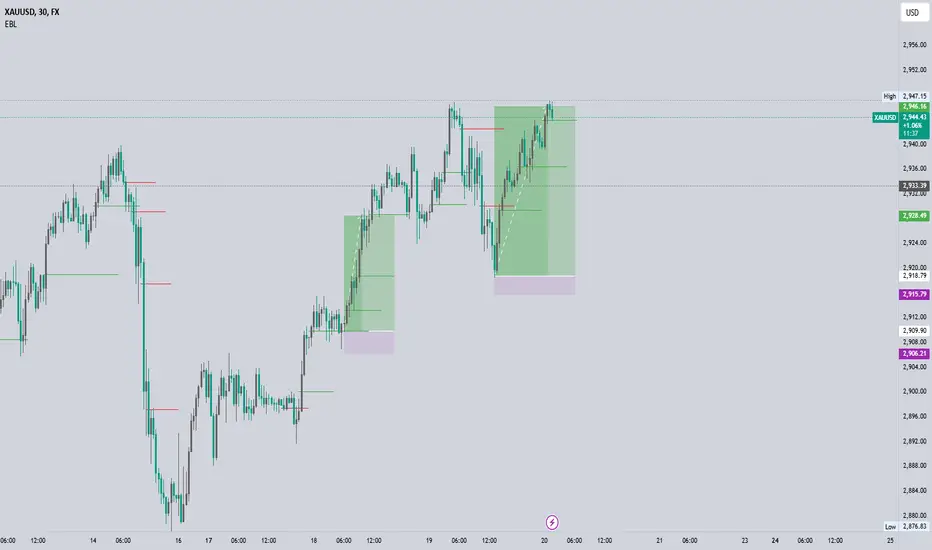
EBL - Enhanced BOS Logic
The EBL (Enhanced Break of Structure Logic) script is a powerful tool for traders who want to identify and act on key structural shifts in the market. By combining visual cues, such as horizontal lines and dynamic arrows, the script highlights critical points of interest where market behavior may indicate significant bullish or bearish momentum.
What Makes EBL Unique?
Break of Structure (BOS) Identification:
The script dynamically detects when price breaks above or below significant highs and lows, marking these levels as key BOS points.
Once a BOS level is confirmed, it is displayed on the chart as a horizontal line, allowing traders to easily identify areas of potential support and resistance.
Real-Time Validation and Invalidations:
Bullish BOS levels remain active until a bearish candle closes below the initiating bullish candle.
Similarly, bearish BOS levels remain active until a bullish candle closes above the initiating bearish candle.
If a BOS level is invalidated, both the corresponding line and its arrow are automatically removed to maintain chart clarity.
Visual Clarity with Arrows and Lines:
Customizable triangle arrows (green for bullish and red for bearish) appear alongside lines to signal entry opportunities.
Traders can adjust line length, colors, and visibility of arrows to fit their charting style.
Alerts for Confirmation:
Receive alerts when bullish or bearish structures are confirmed, ensuring you never miss a signal even when away from your chart.

How the Script Works
Detection of Bullish and Bearish Structures:
The script identifies a "Bullish Break" when the price closes above the high of a bullish candle followed by a bearish one.
A "Bearish Break" is detected when the price closes below the low of a bearish candle followed by a bullish one.
Line and Arrow Placement:
Horizontal lines are drawn at the high or low of the respective BOS level.
Triangular arrows are plotted just below or above the respective levels to indicate potential trade opportunities.
Automatic Cleanup:
When a line is invalidated by opposing market movement, both the line and its connected arrow are automatically removed from the chart.

How to Use EBL
Settings:
Adjust line colors (green for bullish, red for bearish) to suit your charting theme.
Customize arrow visibility or hide lines if you prefer a less cluttered chart.
Set the horizontal line length to match your desired timeframe and analysis depth.
Trading Concepts:
Trend Reversal Zones: Use invalidated BOS levels as signals for possible trend reversals.
Momentum Trading: Follow confirmed BOS levels to identify areas where price momentum is likely to continue.
Dynamic Support and Resistance: Leverage the lines to identify evolving support and resistance zones.
Alerts:
Enable alerts to receive notifications when bullish or bearish trends are confirmed, allowing you to stay informed without constant monitoring.
Conceptual Basis
This script is based on the widely used market structure concept, which is fundamental to price action trading. By tracking the highs and lows created by bullish and bearish movements, the EBL script provides an objective and systematic approach to identifying and trading key structural points in the market.


With the EBL - Enhanced BOS Logic, traders can visually and systematically track market structure, identify potential trade setups, and maintain a cleaner chart with automated line and arrow management. This script is ideal for trend-following, scalping, and swing trading strategies across all markets and timeframes.
The EBL (Enhanced Break of Structure Logic) script is a powerful tool for traders who want to identify and act on key structural shifts in the market. By combining visual cues, such as horizontal lines and dynamic arrows, the script highlights critical points of interest where market behavior may indicate significant bullish or bearish momentum.
What Makes EBL Unique?
Break of Structure (BOS) Identification:
The script dynamically detects when price breaks above or below significant highs and lows, marking these levels as key BOS points.
Once a BOS level is confirmed, it is displayed on the chart as a horizontal line, allowing traders to easily identify areas of potential support and resistance.
Real-Time Validation and Invalidations:
Bullish BOS levels remain active until a bearish candle closes below the initiating bullish candle.
Similarly, bearish BOS levels remain active until a bullish candle closes above the initiating bearish candle.
If a BOS level is invalidated, both the corresponding line and its arrow are automatically removed to maintain chart clarity.
Visual Clarity with Arrows and Lines:
Customizable triangle arrows (green for bullish and red for bearish) appear alongside lines to signal entry opportunities.
Traders can adjust line length, colors, and visibility of arrows to fit their charting style.
Alerts for Confirmation:
Receive alerts when bullish or bearish structures are confirmed, ensuring you never miss a signal even when away from your chart.
How the Script Works
Detection of Bullish and Bearish Structures:
The script identifies a "Bullish Break" when the price closes above the high of a bullish candle followed by a bearish one.
A "Bearish Break" is detected when the price closes below the low of a bearish candle followed by a bullish one.
Line and Arrow Placement:
Horizontal lines are drawn at the high or low of the respective BOS level.
Triangular arrows are plotted just below or above the respective levels to indicate potential trade opportunities.
Automatic Cleanup:
When a line is invalidated by opposing market movement, both the line and its connected arrow are automatically removed from the chart.
How to Use EBL
Settings:
Adjust line colors (green for bullish, red for bearish) to suit your charting theme.
Customize arrow visibility or hide lines if you prefer a less cluttered chart.
Set the horizontal line length to match your desired timeframe and analysis depth.
Trading Concepts:
Trend Reversal Zones: Use invalidated BOS levels as signals for possible trend reversals.
Momentum Trading: Follow confirmed BOS levels to identify areas where price momentum is likely to continue.
Dynamic Support and Resistance: Leverage the lines to identify evolving support and resistance zones.
Alerts:
Enable alerts to receive notifications when bullish or bearish trends are confirmed, allowing you to stay informed without constant monitoring.
Conceptual Basis
This script is based on the widely used market structure concept, which is fundamental to price action trading. By tracking the highs and lows created by bullish and bearish movements, the EBL script provides an objective and systematic approach to identifying and trading key structural points in the market.
With the EBL - Enhanced BOS Logic, traders can visually and systematically track market structure, identify potential trade setups, and maintain a cleaner chart with automated line and arrow management. This script is ideal for trend-following, scalping, and swing trading strategies across all markets and timeframes.
הערות שחרור
The EBL - Enhanced BOS Logic indicator is an advanced tool designed to identify Breaks of Structure (BOS), a key concept in price action trading. By detecting bullish and bearish reversals in the market, this indicator provides traders with precise entry and exit opportunities, coupled with a unique retest alert system that notifies traders when the market is revisiting critical levels.EBL is built on an innovative combination of candlestick pattern recognition, dynamic level plotting, and a customizable threshold for retests, making it highly versatile for both trend-following and countertrend trading strategies. Whether you're a scalper, swing trader, or day trader, the EBL indicator adapts to your trading style by highlighting key market zones with actionable insights.
What Makes EBL Unique?
Break of Structure (BOS) Logic:
Identifies bullish BOS levels (from a bullish candle followed by a bearish reversal) and bearish BOS levels (from a bearish candle followed by a bullish reversal).
Visualizes these levels on the chart with customizable horizontal lines for easy tracking.
Retest Detection with Alerts:
Notifies traders when the price approaches or touches these BOS levels within a user-defined threshold range, helping you anticipate potential reversals or continuations.
Alerts are triggered for both bullish and bearish retests, ensuring you don’t miss critical moments.
Dynamic Line and Arrow System:
Automatically plots horizontal lines for BOS levels with adjustable length and color settings.
Highlights confirmations with arrows for visual clarity, marking price action shifts in real-time.
Customizability and Precision:
Adjust the threshold range for retest alerts, enabling fine-tuned control for different market conditions.
Toggle on/off the display of BOS lines and confirmation arrows to declutter your chart based on preference.
How It Works
The EBL indicator operates based on the following steps:
Candlestick Pattern Detection:
A Bullish BOS is detected when a bullish candle is followed by a bearish candle.
A Bearish BOS is detected when a bearish candle is followed by a bullish candle.
These patterns signify potential market reversals or key structural shifts.
Level Storage and Plotting:
When a BOS is identified, the high of the bullish candle or the low of the bearish candle is stored as a critical level.
The indicator plots horizontal lines at these levels, which act as potential support or resistance zones.
Retest Monitoring:
The indicator continuously checks whether the price approaches stored BOS levels within the user-defined threshold.
If the price comes within the range, an alert is triggered, giving traders a heads-up about potential retests or reactions at these levels.
Invalidation Logic:
If the price breaks through a bullish or bearish BOS level in the opposite direction, the corresponding line is invalidated and removed, ensuring only relevant levels remain on the chart.
How to Use the EBL Indicator
Setup and Inputs:
Bullish Line Color/Bearish Line Color: Customize the colors for BOS levels to fit your charting style.
Horizontal Line Length: Adjust the length of the BOS lines for better visualization.
Retest Threshold: Define the proximity (in percentage) required for the price to trigger a retest alert.
Show Lines/Arrows: Toggle the display of horizontal BOS lines and confirmation arrows.
Trading Strategies:
Breakout and Retest Trading:
Use the indicator to identify BOS levels and wait for a retest within the threshold range to enter a trade.
For bullish setups, enter long positions near retested support levels.
For bearish setups, enter short positions near retested resistance levels.
Reversal Confirmation:
Utilize the confirmation arrows to spot potential reversals and assess market bias.
Trend Continuation:
Monitor BOS levels for trend continuation signals, as these levels often serve as support in uptrends and resistance in downtrends.
Alerts:
Configure TradingView alerts to receive notifications when the price is about to retest a BOS level. This ensures you can take timely action without constantly monitoring the chart.
Underlying Concepts
Break of Structure (BOS):
BOS is a pivotal concept in price action trading that marks shifts in market structure. It helps traders identify when the market transitions from one phase (e.g., bullish to bearish) to another, signaling potential entry or exit points.
In the EBL indicator, BOS levels are derived from candlestick patterns that reflect real-time market psychology.
Support and Resistance Retests:
Once a BOS level is broken, it often acts as a new support or resistance level. The EBL indicator focuses on these retests, which are high-probability zones for market reactions.
Threshold-Based Alerts:
The threshold mechanism ensures traders are notified about retests even if the price deviates slightly from the exact BOS level. This feature accounts for natural market noise and volatility, making the alerts more reliable.
Best Practices
Combine with Other Tools: Use EBL with other indicators, such as moving averages or oscillators, for additional confirmation.
Test in Multiple Markets: Apply the indicator to different asset classes (e.g., forex, stocks, crypto) to observe its performance across various instruments.
Adjust Threshold for Volatility: In volatile markets like cryptocurrency, increase the threshold to capture broader retest ranges. For less volatile assets, reduce the threshold for precision.
Who Is This For?
Scalpers: Quickly identify intraday reversals and retests for rapid decision-making.
Swing Traders: Track key structural levels for multi-day setups.
Day Traders: Stay ahead of price action with real-time alerts and visual cues.
Final Thoughts
The EBL - Enhanced BOS Logic indicator is a powerful and versatile tool that simplifies price action trading. By integrating BOS detection, retest alerts, and customizable visualization, it empowers traders to confidently navigate market structure and capitalize on high-probability opportunities. Whether you're a beginner or a seasoned trader, the EBL indicator adapts to your needs, giving you a competitive edge in today's dynamic markets.
Give it a try, and let the market structure guide your trading decisions!
הערות שחרור
The "EBL - Enigma BOS Logic" indicator is a unique and powerful tool designed to identify and visualize Break of Structure (BOS) patterns in price action, a concept widely used in market structure analysis and Smart Money Concepts (SMC). Unlike generic trend-following or scalping tools, EBL focuses on pinpointing precise moments where market structure shifts occur—those critical points where price breaks key levels after specific candle formations. This indicator stands out by combining a selective candle-pair detection method with dynamic level management, noise filtration, and customizable visuals, making it adaptable to various trading styles, from scalping to swing trading.What It Does
EBL identifies potential reversal or continuation setups by detecting two-candle patterns:
Bullish BOS: A bullish candle (close > open) followed by a bearish candle (close < open), with the high of the bullish candle stored as a key level.
Bearish BOS: A bearish candle (close < open) followed by a bullish candle (close > open), with the low of the bearish candle stored as a key level.
Once these levels are set, EBL waits for price to break above (bullish) or below (bearish) them, signaling a confirmed BOS. It then:
Draws horizontal lines at these levels to mark the structure.
Places arrows (▲ for bullish, ▼ for bearish) when the break is confirmed.
Adjusts or removes lines based on price action, using a buffer zone to filter out false breaks.
How It Works
The indicator’s logic is rooted in market structure analysis, specifically BOS, which occurs when price breaks a prior significant high or low, indicating a shift in supply/demand dynamics. Here’s the step-by-step process:
Candle Pair Detection:
EBL looks for a bullish candle followed by a bearish one (or vice versa). This pattern suggests a potential structure point where momentum may have peaked or bottomed temporarily.
A minimum candle size filter (based on ATR multiples) ensures only significant candles are considered, reducing noise from small, indecisive movements.
Level Storage:
The high of the bullish candle or low of the bearish candle is stored as a key level. These are the "structure points" traders watch for breaks.
Break Confirmation:
A bullish BOS is confirmed when price closes above the stored high, signaling potential bullish momentum.
A bearish BOS is confirmed when price closes below the stored low, indicating potential bearish momentum.
Dynamic Line Management:
Horizontal lines extend from the stored levels for a user-defined number of bars (default: 10).
If price respects the level (e.g., stays above a bullish line), the line extends further.
If price breaks through the level by a buffer zone (e.g., 0.1% of price), the line is deleted, indicating the structure is no longer valid.
Lines also adjust to exact retest points if price touches them without breaking.
Visuals and Alerts:
Arrows mark confirmed breaks, with customizable colors matching the lines (default: green for bullish, red for bearish).
Alerts notify users of confirmed BOS events, ideal for real-time trading.
Originality
EBL’s originality lies in its hybrid approach to BOS detection:
Selective Pattern Recognition: Unlike many indicators that rely on simple highs/lows or moving averages, EBL uses a specific two-candle sequence to define structure points, inspired by SMC principles but simplified for broader use.
Noise Reduction: The ATR-based candle size filter ensures only meaningful setups trigger, avoiding the clutter of generic breakout tools.
Adaptive Lines: The dynamic adjustment and buffer zone logic prevent premature invalidation, making it more practical than static level indicators.
User Control: Extensive customization options (colors, visibility, length, filters) cater to individual preferences, unlike rigid, one-size-fits-all tools.
Underlying Concepts
The calculations are grounded in market structure theory and price action analysis:
Break of Structure (BOS): A core SMC concept where price breaking a prior high or low signals a shift in market control (e.g., buyers overcoming sellers).
True Range (TR) and ATR: Used to position arrows and filter candle size, ensuring signals align with market volatility.
Buffer Zone: A percentage-based threshold (e.g., 0.1%) adds a layer of confirmation, preventing false breaks in choppy conditions.
This isn’t a generic trend detector or oscillator—it’s a precision tool for traders who analyze structure and trade breakouts or retests.
How to Use It
Add to Chart: Copy the script into TradingView’s Pine Editor and add it to your chart.
Customize Settings (via the gear icon):
Bullish/Bearish Line Color: Match your chart theme (default: green/red).
Show Arrows/Lines: Toggle visuals based on preference (default: both on).
Horizontal Line Length: Set how long lines extend (default: 10 bars).
Min Candle Size: Increase (e.g., 1.0) for stricter setups, decrease (e.g., 0.3) for more signals (default: 0.5 ATR).
Buffer Zone %: Adjust sensitivity to invalidation (default: 0.1%).
Interpret Signals:
Bullish BOS (▲): Look for buying opportunities or trend continuation when price breaks above a stored high.
Bearish BOS (▼): Consider selling or shorting when price breaks below a stored low.
Watch lines for retests—price often returns to test these levels before continuing.
Set Alerts: Right-click the indicator, select "Add Alert," and choose "Bullish BOS Confirmed" or "Bearish BOS Confirmed" for real-time notifications.
Best Timeframes: Works on any timeframe, but shines on 5m–1h for scalping/day trading or 4h–D for swing trading.
Trading Tips
Confluence: Combine EBL with support/resistance, Fibonacci levels, or volume to confirm signals.
Volatility: Test on volatile assets (e.g., crypto, forex) for clearer BOS patterns; adjust Min Candle Size for quieter markets.
Risk Management: Use BOS breaks as entry points, with stops below/above the structure level.
Why Use EBL?
If you’re tired of vague trend indicators or overcomplicated systems, EBL offers a clear, structure-based approach to spotting high-probability setups. It’s not just another breakout tool—it’s a disciplined, customizable way to trade market shifts with confidence.
סקריפט קוד פתוח
ברוח האמיתית של TradingView, יוצר הסקריפט הזה הפך אותו לקוד פתוח, כך שסוחרים יוכלו לעיין בו ולאמת את פעולתו. כל הכבוד למחבר! אמנם ניתן להשתמש בו בחינם, אך זכור כי פרסום חוזר של הקוד כפוף ל־כללי הבית שלנו.
כתב ויתור
המידע והפרסומים אינם מיועדים להיות, ואינם מהווים, ייעוץ או המלצה פיננסית, השקעתית, מסחרית או מכל סוג אחר המסופקת או מאושרת על ידי TradingView. קרא עוד ב־תנאי השימוש.