OPEN-SOURCE SCRIPT
Candle Range Theory
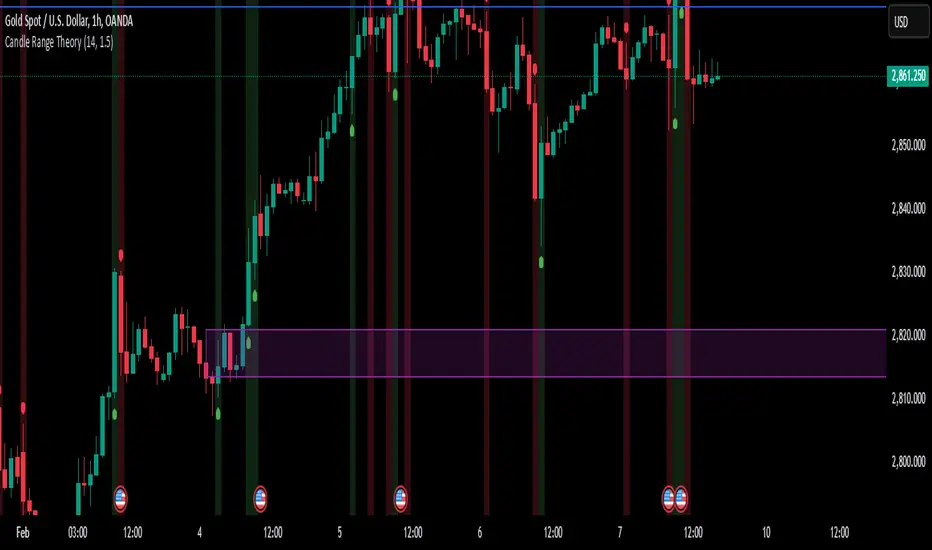
Candle Range Analysis:
Calculates the true range of each candle
Shows a 14-period SMA of the range (adjustable)
Dynamic bands based on standard deviation
Visual Components:
Colored histogram showing range deviations from mean
Signal line for oscillator smoothing
Expansion/contraction zones marked with dotted lines
Arrow markers for extreme range conditions
Key Functionality:
Identifies range expansion/contraction relative to historical volatility
Shows normalized range oscillator (-100% to +100% scale)
Includes visual and audio alerts for extreme range conditions
Customizable parameters for sensitivity and smoothing
Interpretation:
Red zones indicate above-average volatility/expansion
Green zones indicate below-average volatility/contraction
Crossings above/below zero line show range expansion/contraction
Signal line crossover system potential
סקריפט קוד פתוח
ברוח האמיתית של TradingView, יוצר הסקריפט הזה הפך אותו לקוד פתוח, כך שסוחרים יוכלו לעיין בו ולאמת את פעולתו. כל הכבוד למחבר! אמנם ניתן להשתמש בו בחינם, אך זכור כי פרסום חוזר של הקוד כפוף ל־כללי הבית שלנו.
כתב ויתור
המידע והפרסומים אינם מיועדים להיות, ואינם מהווים, ייעוץ או המלצה פיננסית, השקעתית, מסחרית או מכל סוג אחר המסופקת או מאושרת על ידי TradingView. קרא עוד ב־תנאי השימוש.