OPEN-SOURCE SCRIPT
מעודכן Crypto Narratives: Relative Strength
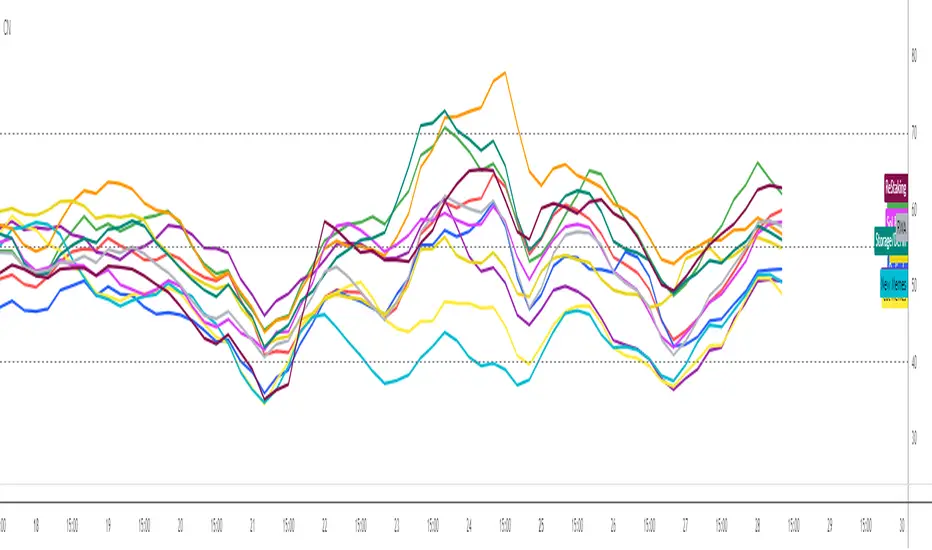
This indicator offers a unique perspective on the crypto market by focusing on the relative strength of different narratives. It aggregates RSI data from multiple tokens associated with each narrative, providing a comprehensive view of the sentiment and momentum behind these themes. You can use it to take profit, find W bottoms or M tops to enter and exit narratives. and generally see what hot at the moment with lots of pretty colours.
This indicator tracks the relative strength of various crypto narratives using the Relative Strength Index (RSI) of representative tokens. It allows users to gauge the momentum and sentiment behind different themes in the cryptocurrency market.
Functionality:
The indicator calculates the average RSI values for the current leading tokens associated with ten different crypto narratives:
- AI (Artificial Intelligence)
- Ordinals
- DeFi (Decentralized Finance)
- Memes
- Gaming
- Level 1 (Layer 1 Protocols)
- Sol Betas (Solana Ecosystem)
- Storage/DePin
- RWA (Real-World Assets)
- ReStaking
he average RSI values for each narrative are calculated by summing the RSI values of the associated tokens and dividing by the number of tokens. The indicator plots the 3-period simple moving average (SMA) of each narrative's RSI using different colors and line styles.
Users can customize the RSI length, line width, and label offset through the input options. If the "Show Labels" option is enabled, the indicator displays labels for each narrative's RSI value on the most recent bar.
The indicator also includes horizontal lines representing overbought and oversold levels, which can be adjusted through the input options. Alerts are triggered when a narrative's RSI crosses above the overbought level or below the oversold level. The alerts include the narrative name, RSI value, and a suggestion to consider selling or buying.
הערות שחרור
Replaced two tickers that were removed from Binanceהערות שחרור
-הערות שחרור
Updated with latest leading tokens and added some new categories like Games, New Memes, Dog Memes and Cat Memesסקריפט קוד פתוח
ברוח האמיתית של TradingView, יוצר הסקריפט הזה הפך אותו לקוד פתוח, כך שסוחרים יוכלו לעיין בו ולאמת את פעולתו. כל הכבוד למחבר! אמנם ניתן להשתמש בו בחינם, אך זכור כי פרסום חוזר של הקוד כפוף ל־כללי הבית שלנו.
כתב ויתור
המידע והפרסומים אינם מיועדים להיות, ואינם מהווים, ייעוץ או המלצה פיננסית, השקעתית, מסחרית או מכל סוג אחר המסופקת או מאושרת על ידי TradingView. קרא עוד ב־תנאי השימוש.
סקריפט קוד פתוח
ברוח האמיתית של TradingView, יוצר הסקריפט הזה הפך אותו לקוד פתוח, כך שסוחרים יוכלו לעיין בו ולאמת את פעולתו. כל הכבוד למחבר! אמנם ניתן להשתמש בו בחינם, אך זכור כי פרסום חוזר של הקוד כפוף ל־כללי הבית שלנו.
כתב ויתור
המידע והפרסומים אינם מיועדים להיות, ואינם מהווים, ייעוץ או המלצה פיננסית, השקעתית, מסחרית או מכל סוג אחר המסופקת או מאושרת על ידי TradingView. קרא עוד ב־תנאי השימוש.