OPEN-SOURCE SCRIPT
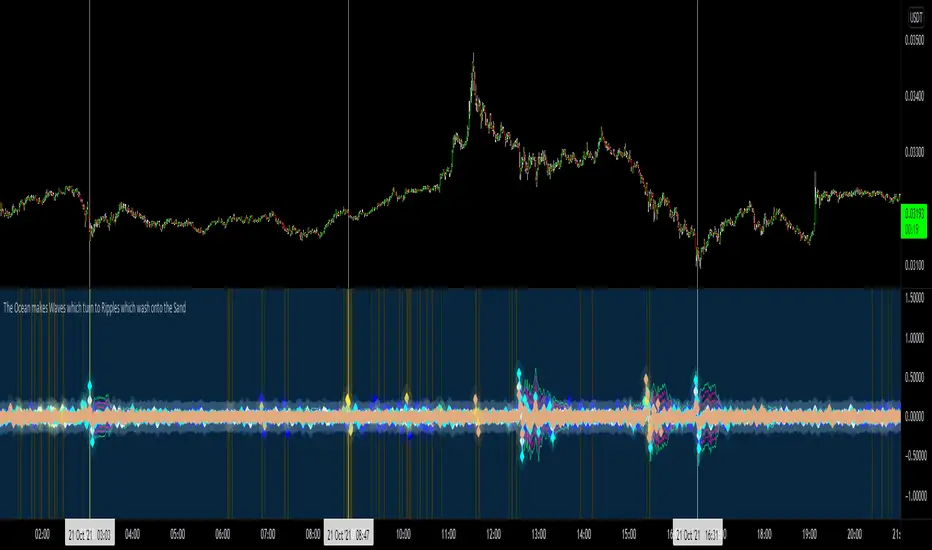
OWRS Volatililility

Bit of a fun indicator taking into the asset names and natural processes and also the fact that the crypto markets are (definitely) not run by weird occultists and naturalists. Looks for disturbances in price of these four key assets. Read into it what you will. Sometimes the clues are just in the names.
Things you will learn from this script:
1. Using security function to compare multiple assets in one indicator.
2. Using indexing to reference historic data.
3. Setting chart outputs such as color based on interrogation of a boolean.
4. To only go back 3-4 iterations of any repeatable sequence as chaos kicks in after 3.55 (Feigenbaum)
1. By extension only the last 3 or 4 candles are of any use in indicator creation.
2. I am almost definitely a pagan.
3. You were expecting this numbered list to go 1,2,3,4,5,6,7. na mate. Chaos.
סקריפט קוד פתוח
ברוח האמיתית של TradingView, יוצר הסקריפט הזה הפך אותו לקוד פתוח, כך שסוחרים יוכלו לעיין בו ולאמת את פעולתו. כל הכבוד למחבר! אמנם ניתן להשתמש בו בחינם, אך זכור כי פרסום חוזר של הקוד כפוף ל־כללי הבית שלנו.
כתב ויתור
המידע והפרסומים אינם מיועדים להיות, ואינם מהווים, ייעוץ או המלצה פיננסית, השקעתית, מסחרית או מכל סוג אחר המסופקת או מאושרת על ידי TradingView. קרא עוד ב־תנאי השימוש.